Pest Control Pricing Guide: What to Charge and Why
A practical guide to pest control pricing — covering service type benchmarks, one-time vs. recurring model economics, cost structure math, and common pricing mistakes.
Pest control pricing has a math problem: most operators set rates by looking at what competitors charge, not by calculating what the work actually costs. The result is a business that stays busy but doesn't produce the margins it should.
This guide covers what customers pay across service types, how to structure one-time vs. recurring pricing, what your cost inputs actually are, and where the most common pricing errors happen.
The Two Business Models — One-Time vs. Recurring
Most pest control businesses sell some combination of both, but the economics are fundamentally different.
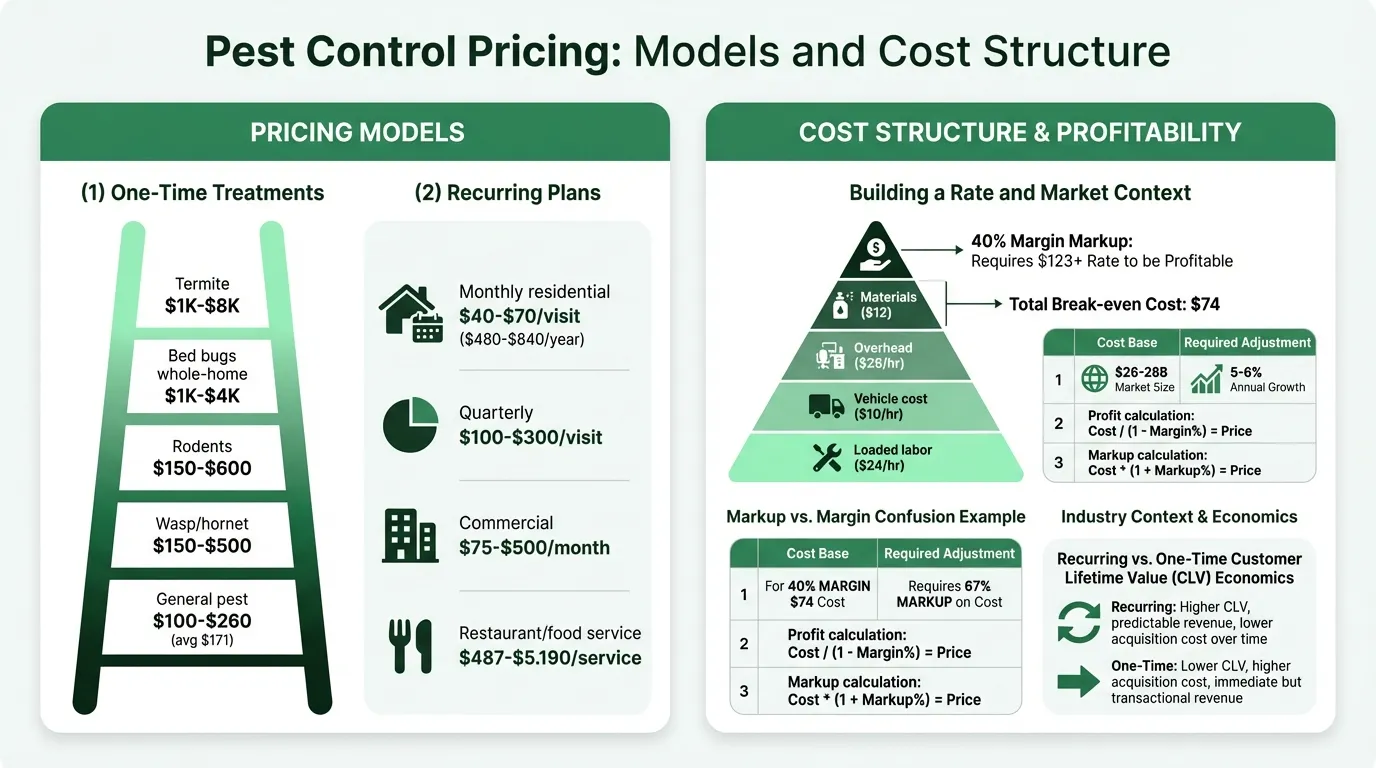
One-time treatments are typically priced at a premium — $100–$550 for residential depending on pest type and severity. Customers pay once, the problem is addressed, and there's no ongoing relationship. One-time treatments cost more to sell (you acquire a customer and keep them for one job), have higher variability in scope, and don't generate the compounding value that makes recurring accounts so profitable at scale.
Recurring plans are the foundation of profitable pest control operations. Customers pay less per visit, but the business benefits from route density, predictable scheduling, lower re-sales cost per customer, and more stable cash flow. Monthly residential plans typically run $40–$70/visit; quarterly plans run $100–$300/visit. Over a year, a customer on a monthly plan generates $480–$840 in revenue vs. one or two one-time purchases.
The standard industry model: charge a higher initial visit fee ($150–$300) to address the presenting problem, then roll the customer into an ongoing plan at a lower per-visit rate. The initial premium covers the higher-effort first treatment. The ongoing plan locks in the customer relationship.
One-time calls and recurring plans should be priced separately — treating them as equivalent is one of the most common structural pricing errors in pest control.
Price Benchmarks by Service Type
These are what customers actually pay. Your cost structure sits below these numbers and determines whether any given job is profitable.
General Pest Control (Residential)
| Service | Typical Range | Notes |
|---|---|---|
| One-time visit | $100–$260 | National average ~$171 |
| Monthly recurring plan | $40–$70/visit | $480–$840/year |
| Quarterly plan | $100–$300/visit | $400–$1,200/year |
| Bi-monthly (every 2 months) | $50–$85/visit | $300–$510/year |
| Annual single visit | $300–$550 | No prevention benefit |
Specialty Treatments
| Pest / Treatment | Typical Range | Notes |
|---|---|---|
| Termite — liquid barrier | $1,000–$3,200 initial; $100–$300/yr renewal | $3–$16/linear foot of foundation |
| Termite — bait system | $1,500–$3,000 setup; $300–$500/yr maintenance | Colony collapse over months |
| Termite — tenting/fumigation | $2,000–$8,000 | For severe/whole-home infestations |
| Bed bugs — heat treatment | $400–$5,500 | $1–$3/sq. ft./room |
| Bed bugs — chemical | $150–$400/room | $2–$5/sq. ft. |
| Bed bugs — whole home average | $1,000–$4,000 | Severe cases: $3,500–$5,000+ |
| Rodents (mice) | $150–$300 | Initial treatment |
| Rodents (rats) | $300–$600; up to $1,200 for extensive work | |
| Mosquito control | $80–$150/visit; $350–$1,000/season | Yard size dependent |
| Wasp/hornet removal | $150–$300 (standard); $300–$500 (complex) | Usually one-time |
| Cockroaches | $100–$600 | Varies by method and severity |
| Fleas | $100–$400 |
Commercial Pricing
| Property Type | Typical Range | Notes |
|---|---|---|
| Small/medium business (monthly) | $75–$500/month | Office, retail, small service |
| Restaurant / food service | Higher end; $487–$5,190/service | Regulatory pressure drives frequency |
| Large properties (warehouse, industrial) | $750+/month; $1,500–$5,000+/service | Square footage and complexity dependent |
| Emergency service surcharge | 20–40% above standard | Off-hours, urgent response |
Commercial pricing runs 2–5x higher than residential across similar service types. The drivers are square footage, regulatory compliance requirements (especially in food service), and higher liability exposure if treatment fails.
What Drives Your Actual Costs
Setting prices requires knowing your costs first — not your competitors' rates.
Chemical and Materials Costs
Pest control materials are a significant cost variable, unlike industries where labor dominates. Treatment products vary widely in cost depending on the pest and method:
- General perimeter treatments use relatively low-cost products; the main cost is labor time
- Termite liquid treatments require significant product volume — whole-slab applications on larger homes use substantial quantities of termiticide
- Bed bug heat treatments require specialized equipment (heat units, fans, monitoring devices) that must be amortized across jobs
- Rodent programs involve trap purchase, bait replenishment, and multiple follow-up visits
Materials on a general service call might run $5–$20. A termite treatment on a 2,000 sq. ft. home can involve $200–$600 in materials alone. If material cost isn't built into each service type's pricing separately, termite and bed bug treatments will consistently underperform on margin.
Loaded Labor Rate
A technician earning $18/hour doesn't cost $18/hour to employ:
- FICA and Medicare (employer): 7.65% of wages
- State and federal unemployment insurance: ~2–3% of wages
- Workers' compensation: pest control typically runs in the $7–$10 per $100 of payroll range — materially higher than most service industries due to chemical handling and exposure risk
In total, add 25–35% on top of base wages to get loaded labor cost. A $18/hour technician costs roughly $23–$25/hour fully loaded before overhead.
Vehicle and Equipment Costs
Each service vehicle carries annual costs: fuel, insurance, maintenance, registration, and eventual replacement. Divide total annual fleet cost by total annual billable hours to get a per-hour cost to assign to jobs. Many operators run $8–$15/billable hour in vehicle costs alone.
Overhead
Annual overhead includes: liability and E&O insurance, pesticide licensing fees, software, marketing, administrative time, office costs, and owner compensation to the extent not already in labor.
The same overhead calculation applies here as in any service business: total annual non-job costs divided by actual billable hours gives your overhead cost per hour. For a solo or small-crew operation, this can easily run $20–$40 per billable hour depending on business scale.
Building a Rate
| Component | Example |
|---|---|
| Loaded labor (per technician per hour) | $24/hr |
| Vehicle cost per hour | $10/hr |
| Overhead allocation per hour | $28/hr |
| Materials per service (average) | $12 |
| Total cost per 1-hour service call | $74 |
| Target gross margin (40%) | $74 ÷ 0.60 |
| Required minimum rate | ~$123 |
A one-time general pest control visit priced at $100 doesn't cover costs at this structure. The market price of $100–$260 provides the margin to actually profit — but only if you price toward the middle or upper end of that range rather than assuming the floor is workable. Run your own numbers through the pest control break-even calculator to find the minimum visit price your cost structure supports.
How to Price Recurring Plans
Recurring plan pricing requires a different lens than one-time jobs. The key variables:
Route density: Two properties on the same street cost far less to service than two properties 15 miles apart. Route efficiency directly drives margin on recurring accounts. When you're building a recurring book of business, dense routes allow the same technician hours to service significantly more accounts, improving profit per hour dramatically.
Customer lifetime value: A recurring monthly customer at $55/month generates $660/year. If your customer acquisition cost (marketing, sales time, initial visit subsidy) is $150, that's recovered in under three months. Recurring plan pricing can afford a modest premium on the initial visit and still produce excellent economics over the lifetime of the account.
Churn and cancellation: If 20% of your monthly plan customers cancel each year, you need a pipeline of new customers to replace them. Factor acquisition cost into your overall pricing model, not just the per-visit economics.
Contract vs. month-to-month: Annual contracts improve route planning predictability. Many operators offer a small discount (5–10%) for annual commitment. Month-to-month customers who cancel after two visits don't recover the acquisition investment — consider this when deciding whether to offer month-to-month plans without an initial fee premium.
Need a ready-made budget template for your pest control?
Download a pre-built spreadsheet with industry-specific categories, formulas, and formatting.
The Markup vs. Margin Confusion
This math error is common in service businesses: a 25% markup on cost produces a 20% gross margin, not 25%.
If your cost for a job is $100 and you want a 35% gross margin:
Price = $100 ÷ (1 − 0.35) = $154
A 35% markup on $100 is $135 — but that's only a 26% gross margin.
| Target Gross Margin | Required Markup on Cost |
|---|---|
| 20% | 25% |
| 30% | 43% |
| 40% | 67% |
| 50% | 100% |
For pest control businesses targeting 40–50% gross margins on recurring service, this distinction matters. Use Price = Cost ÷ (1 − Target Margin) when pricing any job, or use the pest control markup calculator to convert between the two.
Common Pricing Mistakes
Not separating service types. General pest control, termite treatment, and bed bug treatment have completely different cost structures. A pricing formula built around general quarterly service will underprice a bed bug heat treatment by $500–$2,000 if you apply the same logic. Each service category needs its own cost-to-price analysis.
Pricing one-time calls too low. One-time visits cost more to sell and deliver than recurring visits — there's no route optimization benefit, the scope may be unclear, and the customer isn't locked into a relationship. One-time pricing should be at a premium, not discounted to win the job.
Underestimating materials on specialty work. Termite and bed bug treatments involve equipment that needs to be amortized across jobs. If heat treatment equipment costs $15,000 and lasts 1,000 jobs, that's $15/job in equipment cost that needs to be in the price. Many operators don't account for this.
Not raising prices when input costs rise. Workers' compensation rates, fuel costs, chemical product prices, and minimum wages have all increased. Pricing that was profitable two years ago may not be profitable today. Review pricing at minimum annually against current cost inputs.
Racing to the bottom on initial visit pricing. Discounting the first visit to acquire a customer can make sense if your customer LTV justifies it and you account for the acquisition cost explicitly. Discounting because you're competing with a lowball competitor is a path to low-margin work and customers who expect perpetual discounts.
Not charging for exclusion work separately. Sealing entry points — caulking gaps, installing door sweeps, screening vents — is skilled labor billed at hourly rates ($75–$150/hr). It's not a courtesy add-on to a service call. Define what's in the treatment price and what requires a separate exclusion estimate.
Industry Context
The U.S. pest control market is approximately $26–$28 billion annually and has grown at roughly 5–6% per year, making it one of the more consistently growing service industries. Termites alone affect over 600,000 homes per year and cause more than $5 billion in property damage annually — which creates a structural, recurring demand for termite prevention programs independent of the general pest market.
The pest control industry's recession resistance comes from necessity: pests don't pause during economic downturns, and both residential homeowners and commercial operators (especially food service) have non-discretionary treatment needs regardless of the economic environment.
Average U.S. pest control company gross margins run approximately 45%, with meaningful variation based on service mix, route density, and whether the business has significant recurring revenue vs. one-time work.
The Numbers to Track
Gross margin by service type. Revenue minus direct labor, materials, and vehicle costs, by category. General recurring service should hit 45–55%. Specialty treatments (termite, bed bug) should hit 40–50% if priced correctly. Any service category running below 35% needs cost or pricing investigation.
Revenue per technician-day. Total revenue divided by total technician field days. This tells you whether pricing and route density are generating adequate throughput per labor unit. Low revenue-per-day almost always points to underpriced jobs or routing inefficiency.
Recurring vs. one-time revenue mix. Track the percentage of monthly revenue from recurring contracts vs. one-time service calls. A business with 60–70% recurring revenue has far more stable cash flow and lower acquisition cost drag than one heavily dependent on one-time calls.
Customer acquisition cost. Total sales and marketing spend divided by new customers acquired. If you're spending $200 to acquire a monthly plan customer at $55/month, you need 4+ months to recover that cost. If recurring plan customers churn within 3 months on average, that's a structural problem regardless of how healthy your per-visit margin looks.
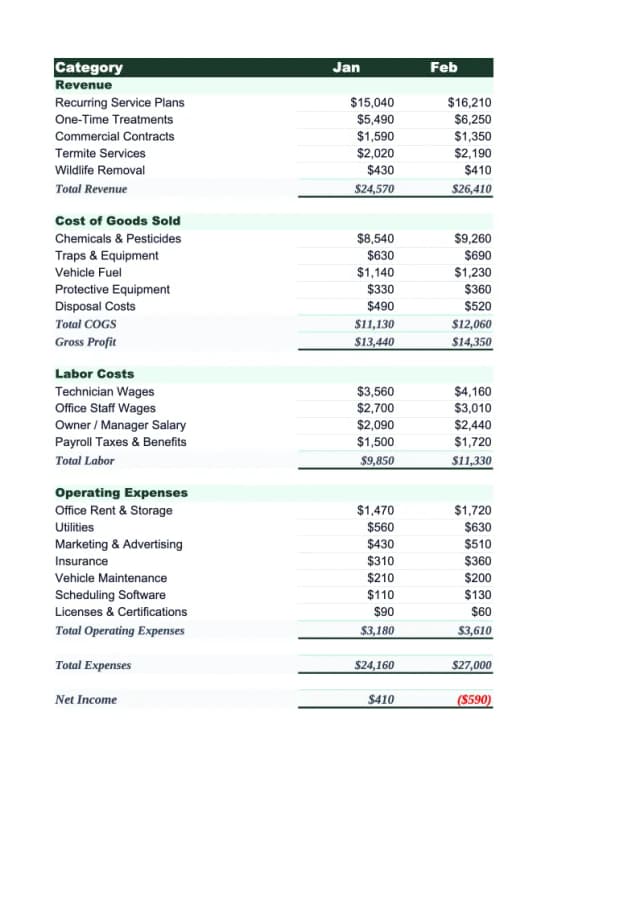
Tracking these numbers monthly — rather than discovering problems at year-end — is what separates operators who know where their margin is going from those who are perpetually surprised by thin profits despite staying busy. The Pest Control Income Statement Template is organized by service type so margin-by-category tracking is straightforward rather than requiring a custom analysis each quarter. For annual planning, the Pest Control Budget Template structures overhead and route costs alongside revenue targets.
Starting From Costs
The pest control businesses with consistent 15–20% net margins know their cost structure. They've calculated loaded labor including workers' comp (which is high in this industry), know their vehicle cost per hour, have allocated overhead to jobs, and have built materials cost into each service category separately.
If you haven't run those numbers, start with overhead: add up all annual non-job costs, divide by actual billable technician-hours, and check whether that per-hour number is in your current pricing. Most operators who run this calculation for the first time find a gap — especially on specialty treatments where materials and equipment cost are easy to underestimate.
Last updated: March 25, 2026
Frequently Asked Questions
Related Articles
Auto Repair Pricing Guide: How to Price Your Shop Profitably
How auto repair shop owners should price labor and parts — covering labor rate calculation, flat-rate hours, parts markup matrices, diagnostic fees, and the metrics that matter.
Cleaning Service Pricing Guide: How to Price Your Business Profitably
A practical guide to cleaning service pricing — covering hourly vs. flat rate vs. per square foot models, price benchmarks by service type, labor cost math, and the common mistakes that keep cleaning businesses from hitting their margin targets.
Construction Pricing Guide: How to Price Your Work Profitably
How contractors should price construction work — covering labor burden, overhead recovery, material markup, pricing methods, and the mistakes that quietly erode margin.
Electrical Pricing Guide: How to Price Your Work Profitably
How electricians and electrical contractors should price their work — covering hourly rates, flat-rate pricing, overhead recovery, material markup, and common mistakes that erode margin.
Hotel Sales Forecast: A Practical Example and Guide
How to build a hotel sales forecast — covering rooms, F&B, events revenue, key metrics like RevPAR and ADR, booking pace, and the rolling forecast structure that keeps you ahead.
Landscaping Pricing Guide: How to Price Your Work Profitably
A practical guide to landscaping pricing — covering hourly rates, per-square-foot benchmarks, overhead recovery, and the markup math that determines whether you're making money.