Restaurant Pricing Guide: How to Set Menu Prices That Actually Work
A practical guide to restaurant menu pricing — covering food cost math, contribution margin, menu engineering, prime cost benchmarks, and the most common mistakes.
Restaurant menus aren't priced — they're negotiated. You're negotiating between what ingredients cost, what labor costs, what the local market will pay, and what competitors charge. Most operators set prices once and adjust them infrequently, which means the negotiation usually goes in the wrong direction over time.
This guide covers the mechanics: how to calculate prices from costs, how to evaluate your menu once prices are set, what benchmarks actually look like, and where the most expensive mistakes happen.
Food Cost Percentage: The Starting Point
The standard framework for restaurant menu pricing starts with food cost percentage — the ratio of ingredient cost to menu price.
Formula: Food Cost % = (Ingredient Cost ÷ Menu Price) × 100
To price an item using a target food cost percentage:
Formula: Menu Price = Ingredient Cost ÷ Target Food Cost %
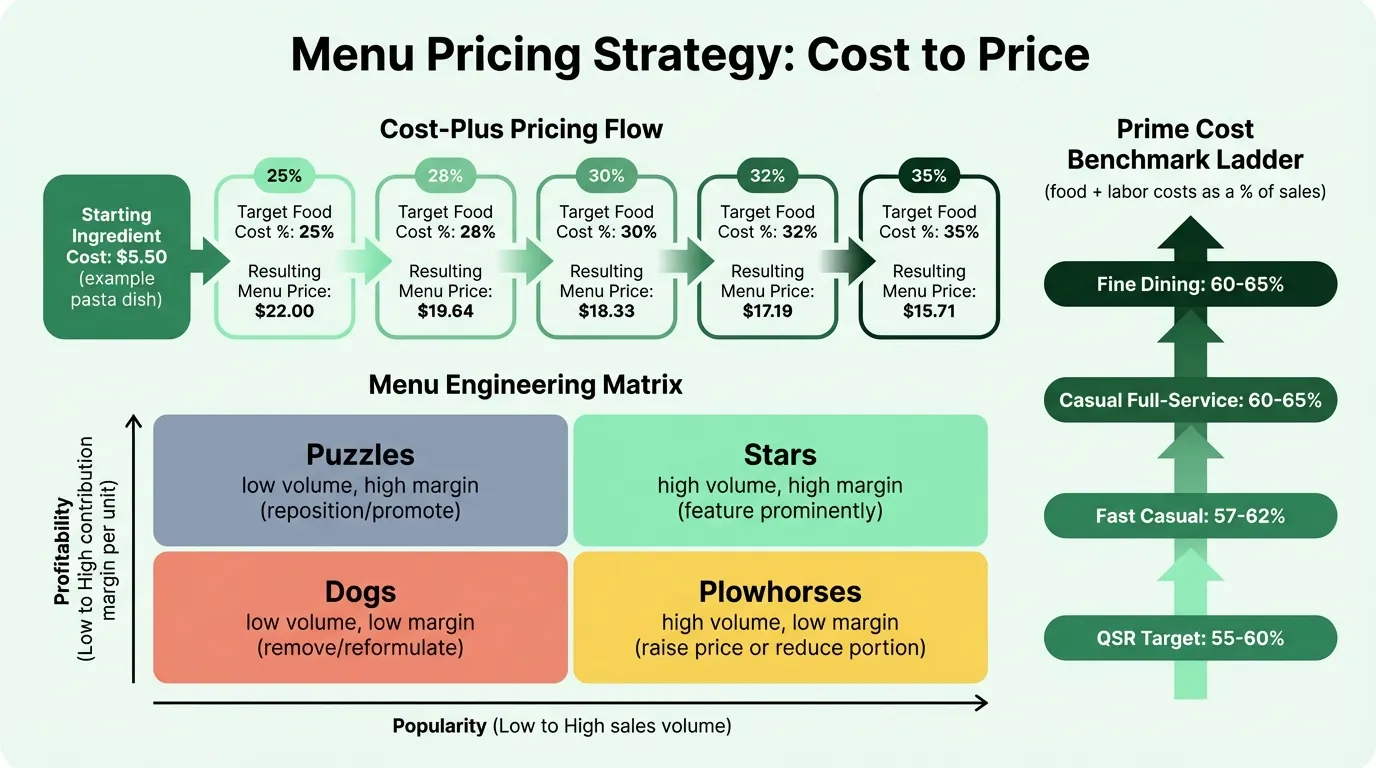
If a pasta dish costs $4.80 in ingredients and your target food cost is 30%:
$4.80 ÷ 0.30 = $16.00 menu price
National Restaurant Association data from 2024 puts the median food and non-alcohol beverage cost at 32.0% for full-service restaurants and 32.4% for limited-service. The widely used rule of thumb is 28–32% for casual and quick-service formats; fine dining typically runs 32–38% because of premium ingredient quality, though higher menu prices produce strong contribution margins even at those percentages.
Cost per serving vs. recipe cost
The ingredient cost in your formula needs to reflect what the dish actually costs to plate — not what the recipe says it should cost. Account for:
- Yield loss: A 10-oz chicken breast loses weight during trimming and cooking. Cost on the raw weight; price based on the trimmed, cooked yield
- Portion consistency: A 6-oz burger that's routinely plated at 6.5 oz has a 8% cost overrun on every ticket
- Waste and over-prep: Produce that spoils, proteins that get mis-cooked and discarded, prep that exceeds service needs
Many restaurants find that their actual food cost runs 2–4 percentage points higher than their theoretical recipe cost. If your target is 30% and your portion control is loose, you may be running at 33–34% without knowing it. The restaurant food cost calculator lets you compare theoretical recipe cost against actual plate cost for each menu item.
The Cost-Plus vs. Contribution Margin Methods
Cost-plus pricing (dividing food cost by target percentage) is the most common approach. It ensures you always clear your cost floor. The limitation: it prices everything independently, without considering how much absolute profit each item generates per plate.
The contribution margin method prices items based on the fixed dollar amount of profit they need to generate, not the percentage:
Contribution Margin = Menu Price − Food Cost (per item)
A dish priced at $24 with $7.20 in food cost has a contribution margin of $16.80 — the dollars available to cover labor, rent, and profit after ingredient cost.
Why this matters: a $9 appetizer at 30% food cost contributes $6.30 per sale. A $28 entrée at 35% food cost contributes $18.20 per sale. The appetizer looks better on food cost percentage; the entrée generates three times as much toward covering your fixed costs per order.
Use cost-plus as the pricing floor. Use contribution margin to evaluate whether that floor is actually generating enough profit from each item, especially your high-volume sellers. The restaurant markup calculator makes it straightforward to compare cost-plus and contribution margin pricing side by side.
Prime Cost: The Number That Really Matters
Food cost percentage is a useful benchmark, but it only captures ingredient expense. Prime cost — food cost plus labor cost combined — gives the complete picture of what it actually costs to produce and serve the food.
Prime Cost = Food Cost + Labor Cost (as % of sales)
Industry benchmarks by segment:
| Segment | Prime Cost Target |
|---|---|
| Quick service (QSR) | 55–60% of sales |
| Fast casual | 57–62% of sales |
| Casual full-service | 60–65% of sales |
| Fine dining | 60–65% of sales |
NRA 2024 data puts median labor costs at 30.4% of sales for limited-service restaurants and 36.5% for full-service. Combined with median food costs in the 32% range, prime costs are sitting at 62–69% for many full-service operators — above the traditional 65% target.
A restaurant running a 34% food cost and 38% labor cost has a 72% prime cost, leaving only 28% of revenue to cover rent, utilities, marketing, insurance, and profit. Net margins in that scenario are typically 0–2%. The math doesn't leave room for error.
When margins feel thin despite reasonable revenue, prime cost is where to start the investigation. Either food cost is too high (pricing, portions, or waste), labor cost is too high (scheduling, tipping model, staffing-to-volume match), or — often — both.
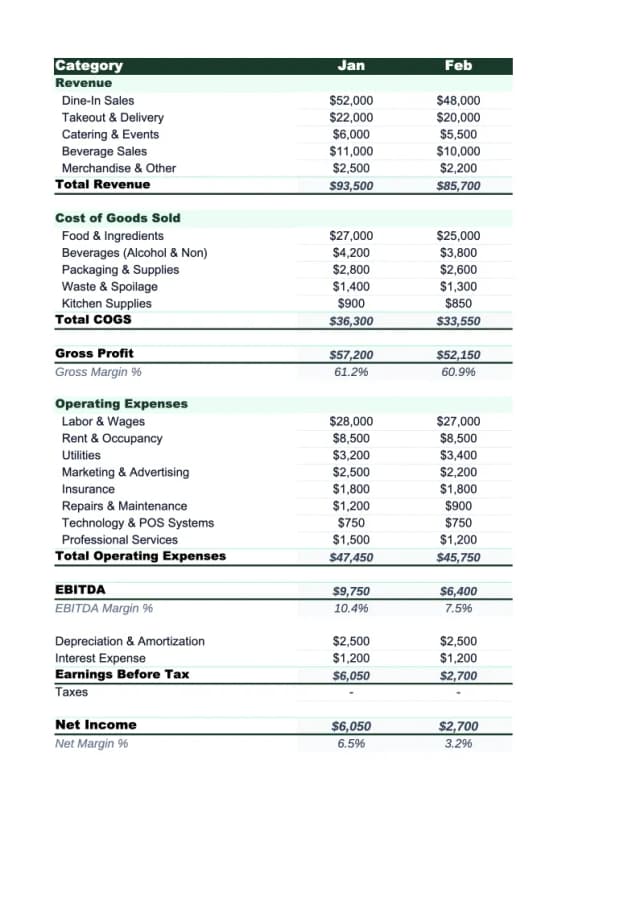
The Restaurant P&L Template tracks prime cost components month by month and makes it straightforward to spot when one line is pulling your combined cost above target.
How Restaurant Type Affects Pricing Strategy
The same cost-plus formula applies across segments, but the price points, margin structure, and pricing strategy differ significantly:
| Factor | QSR / Fast Food | Fast Casual | Casual Dining | Fine Dining |
|---|---|---|---|---|
| Avg check per person | $8–$11 | $11–$16 | $15–$25 | $80–$350+ |
| Food cost target | 25–30% | 27–32% | 28–35% | 32–38%+ |
| Labor cost % | Lower | Moderate | 30–35% | 35%+ |
| Net profit margin | 6–9% | ~17% (strong) | 2–6% | 2–6% |
| Primary pricing driver | Volume + efficiency | Value perception | Experience + value | Value-based + prestige |
Fast casual currently shows the highest net margins of any segment — roughly 17% for strong-performing concepts. The economics are favorable: counter service (lower labor) combined with a quality-focused positioning that supports higher prices than traditional QSR.
Fine dining runs on low volume per day but high contribution margin per cover. Pricing is almost entirely value-based — the quality of the experience, service, and ingredient sourcing justifies prices that would be untenable at casual concepts. Food cost percentage is higher, but because contribution margin per plate is $40–$80+, the absolute dollar economics work.
For casual full-service, the challenge is managing costs while staying price-competitive with fast casual alternatives. The typical net margin of 2–6% means a restaurant doing $1.5M in annual sales might retain $30,000–$90,000 in net profit — a thin cushion for any cost spike.
Need a ready-made p&l template for your restaurant?
Download a pre-built spreadsheet with industry-specific categories, formulas, and formatting.
Menu Engineering: Evaluating What's Working
Once prices are set, menu engineering tells you whether the pricing and positioning are producing the right results. Developed in the 1980s by Michigan State professors Donald Smith and Michael Kasavana, the framework plots every menu item on a 2×2 matrix:
| Category | Popularity | Profitability | Strategy |
|---|---|---|---|
| Stars | High | High | Feature prominently — these are your best items |
| Plowhorses | High | Low | Raise price, reduce portion, or pair with high-margin items |
| Puzzles | Low | High | Reposition — rename, move on menu, add description, or promote |
| Dogs | Low | Low | Remove or reformulate; rarely worth keeping |
How to run the analysis:
- Pull sales count and food cost for each item over a 30–60 day period
- Calculate contribution margin per item: Menu Price − Food Cost
- Calculate each item's share of total sales volume
- Items above the menu average in sales volume are "high popularity"; items above average in contribution margin are "high profitability"
- Plot each item into the quadrant
The typical finding: 10–15% of items are Plowhorses — they sell well but at margins that drag down your overall food cost. Small price increases on high-volume Plowhorses have outsized impact. If an item sells 40 times per day and you raise its price by $1.50, that's $60/day, or roughly $21,000/year in additional contribution margin — without touching any other item.
Menu layout reinforces the engineering. Eyes move to the upper right corner of a menu first, and "eye magnets" (photos, boxes, descriptions) draw attention. High-margin items positioned in those zones convert higher-margin interest into actual sales.
Psychological Pricing Tactics That Work
Several techniques reliably affect what customers order and how much they spend:
Remove dollar signs. A Cornell University study found that guests given menus without dollar signs spent significantly more than those with them. The "$" symbol triggers a psychological association with money leaving one's possession. Most modern menus use numerals only.
Price anchoring. Placing a high-priced item at the top of a category makes everything below it seem more reasonable. A $58 entrée makes the $36 options look like value — even if $36 is still a premium price. Place your anchors strategically; they don't need to be your highest-margin items.
Avoid round numbers for some items. Prices like $17.95 or $22 can read differently depending on the concept. Fine dining often uses round numbers ($28, $45) because they feel less transaction-focused. Casual dining frequently uses charm pricing ($13.95, $18.75) to soften price perception.
Limit options. Menus with fewer items typically outperform sprawling menus on both customer satisfaction and average check. Each additional category adds decision fatigue. The simplification dividend applies to pricing too — fewer items makes engineering and costing more manageable.
Common Pricing Mistakes
Not updating food costs when ingredient prices change. Food commodity prices can shift 10–20% in a quarter. Proteins especially fluctuate. A menu priced on Q4 costs may be significantly underpriced by Q2 without anyone noticing, because margins erode gradually rather than all at once.
Using blanket price increases. A uniform 5% increase across all items doesn't typically yield a 5% revenue improvement. Customers react by ordering fewer items or choosing lower-priced options. Targeted increases on high-volume, low-sensitivity items consistently outperform blanket hikes. Price increases on beverages, which have very low food cost, typically face less pushback than protein-heavy entrees.
Not accounting for waste in food cost calculations. If your costing spreadsheet uses the recipe yield and your kitchen runs 5–8% waste, every price calculation is systematically too low. Run a waste audit for one week and adjust your food cost inputs. The restaurant inventory management best practices guide covers waste tracking systems that capture the data you need for accurate costing.
Pricing against competitors without running the cost math. A competitor's menu price tells you what they charge — not whether they're profitable at it. If they're running at 3% net margin, matching their prices replicates their problems.
Not reviewing pricing on a schedule. Industry advisors recommend reviewing pricing every 12–18 months and adjusting in increments of 1–1.5%. Restaurants that let pricing sit for 2–3 years while food and labor costs rise are giving margin away slowly and then face large, disruptive increases when they finally act. Only 21% of customers accept increases above 3%, which means large infrequent hikes carry more guest-count risk than small regular ones.
Ignoring delivery platform economics. Restaurants applying their in-house menu prices to third-party delivery platforms are typically losing money on every delivery order. Platform commissions run 15–30% per order. The average restaurant markup on delivery platforms is approximately 24%. If your in-house margin is already thin, delivery at standard prices means selling at a loss. Either price delivery menus separately or use delivery only for items where contribution margin is strong enough to absorb platform fees.
The Numbers to Track Monthly
Food cost % — Total food and beverage cost divided by total food and beverage revenue. Compare against your target and against prior months. A food cost creeping up 1–2 percentage points over a quarter usually signals a portion control or waste issue before it becomes visible on the P&L.
Prime cost % — Food cost plus labor cost as a percentage of revenue. Target 55–65%. Above 65% consistently means either pricing is too low or one of the two cost lines is out of control.
Contribution margin per cover — Total contribution (revenue minus food cost) divided by covers served. This tells you whether your pricing and menu mix are generating enough per-guest to cover fixed costs. If average check rises but contribution per cover stays flat, you may be selling more of your high-food-cost items.
Menu mix % — What percentage of sales each item represents. Run this monthly against your engineering analysis to see whether your Stars are maintaining share and whether Puzzles are improving with any repositioning actions.
The Restaurant Budget Template and Restaurant Income Statement Template give you the framework to track these metrics month by month without building custom reporting from scratch.
Start With the Cost Math
Menu pricing gets complicated when operators try to balance too many inputs simultaneously. Start with the cost floor: calculate accurate ingredient cost per serving (including yield loss and actual portioning), divide by your target food cost percentage, and compare the result against the market.
That comparison usually reveals one of three situations: your cost structure supports competitive pricing (proceed), your food costs are too high to price competitively (reformulate or substitute), or your market won't support the prices you need (reconsider the concept or cost structure).
Most restaurants find their food cost target is achievable — the gap is usually in portion consistency, waste management, or the infrequency of price reviews. Closing those gaps doesn't require a menu overhaul. It requires the habit of running the numbers regularly.
Last updated: March 25, 2026
Frequently Asked Questions
Related Articles
Auto Repair Pricing Guide: How to Price Your Shop Profitably
How auto repair shop owners should price labor and parts — covering labor rate calculation, flat-rate hours, parts markup matrices, diagnostic fees, and the metrics that matter.
Cleaning Service Pricing Guide: How to Price Your Business Profitably
A practical guide to cleaning service pricing — covering hourly vs. flat rate vs. per square foot models, price benchmarks by service type, labor cost math, and the common mistakes that keep cleaning businesses from hitting their margin targets.
Construction Pricing Guide: How to Price Your Work Profitably
How contractors should price construction work — covering labor burden, overhead recovery, material markup, pricing methods, and the mistakes that quietly erode margin.
Electrical Pricing Guide: How to Price Your Work Profitably
How electricians and electrical contractors should price their work — covering hourly rates, flat-rate pricing, overhead recovery, material markup, and common mistakes that erode margin.
Hotel Sales Forecast: A Practical Example and Guide
How to build a hotel sales forecast — covering rooms, F&B, events revenue, key metrics like RevPAR and ADR, booking pace, and the rolling forecast structure that keeps you ahead.
Landscaping Pricing Guide: How to Price Your Work Profitably
A practical guide to landscaping pricing — covering hourly rates, per-square-foot benchmarks, overhead recovery, and the markup math that determines whether you're making money.