Restaurant Income Statement Template
A restaurant income statement template with food cost, labor, and operating expense line items built in — so you can see your actual margins without building a spreadsheet from scratch.
What's Inside This Restaurant Income Statement Template
This template includes 4 worksheets, each designed for a specific part of your restaurant financial workflow:
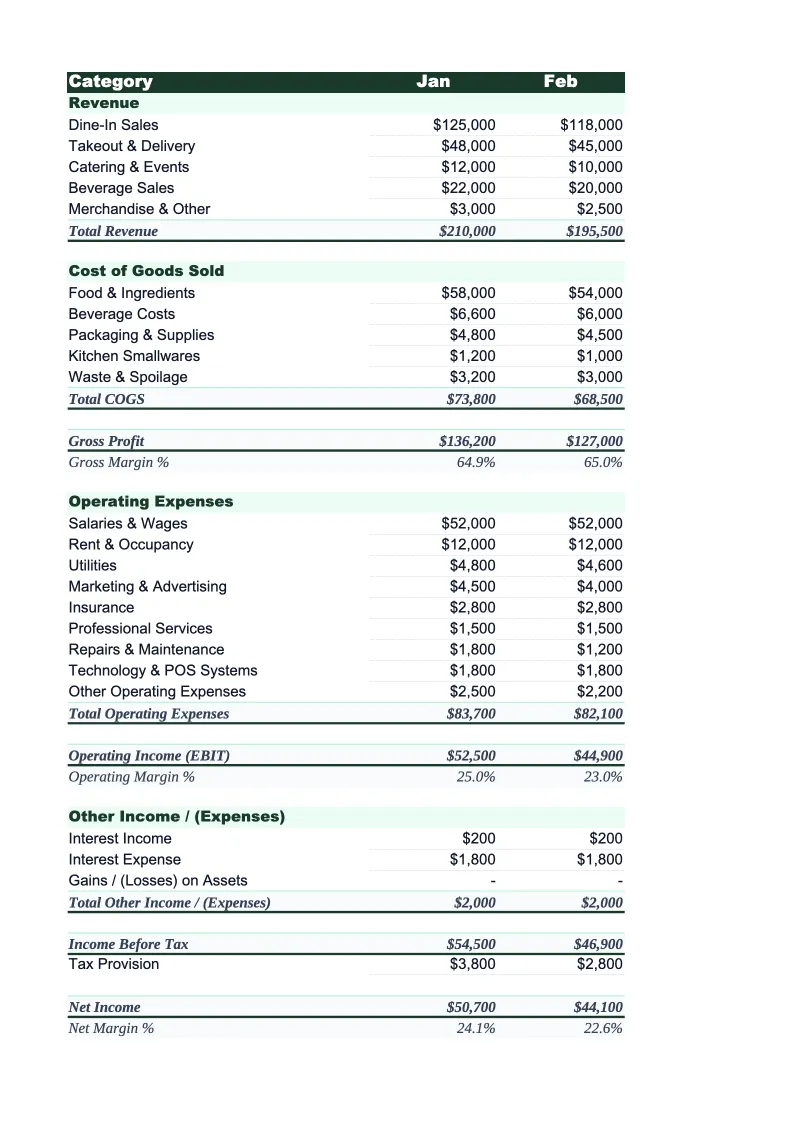
Monthly Income Statement
The core P&L worksheet, structured the way restaurant accountants actually build them.
Annual Summary
A 12-month rollup that consolidates your monthly statements into a single view.
Key Ratios
A dedicated worksheet that tracks the financial ratios that matter most in food service.
Department P&L
An optional breakdown sheet that separates your restaurant's income statement by revenue center — typically dine-in, bar, catering, and delivery.
Restaurant Income Statement Template Features
- Revenue split by food, beverage, catering, and delivery channel
- COGS separated into food cost and beverage cost with auto-calculated percentages
- Labor breakdown by front-of-house, back-of-house, and management
- Prime cost, EBITDA, and net margin calculated automatically
- 12-month annual summary with year-to-date running totals
- Key ratio tracker with industry benchmark ranges built in
How to Use This Restaurant Income Statement Spreadsheet
Start by downloading the .xlsx file and opening it in Excel or Google Sheets — no macros or add-ins needed. Open the Monthly Income Statement sheet and review the pre-loaded categories. Most restaurants will keep the structure as-is: adjust the revenue line items to match your channels (add a line for gift card redemptions, remove catering if it's not applicable), and tweak any operating expense labels that don't match your chart of accounts. This initial setup takes 10–15 minutes and you only do it once.
Each month, enter your actual revenue and expense figures from your POS reports and bank statements. Start with revenue totals at the top, then work down through food cost and beverage cost, then labor by department, then the fixed and semi-fixed expenses at the bottom. The gross profit, prime cost, EBITDA, and net income lines calculate automatically. Once the monthly sheet is complete, the Annual Summary and Key Ratios sheets update without any extra steps.
15 minutes from download to your first income statement
Download the template, enter your revenue and costs, and see your restaurant's actual margins — food cost percentage, prime cost, EBITDA, and net income all calculated automatically.
Why Every Restaurant Needs a Proper Income Statement
Restaurants operate on margins that leave almost no room for error. Average net margins in food service run 3–9%, which means that a food cost running 3 percentage points above target — $3,000 overspent on a $100,000 revenue month — can cut your net income in half. The income statement is where these numbers show up. Without one, you're flying on gut feel and bank balance, which is why so many restaurants that are busy and full still struggle at the end of the quarter.
A restaurant income statement follows a specific structure that's different from generic business P&Ls. Revenue is split by channel because food, beverage, catering, and delivery have different margin profiles. COGS is split between food cost and beverage cost because they're managed separately — a wine list running at 30% beverage cost is a different problem from proteins running at 38%. Below the gross profit line, labor is the biggest variable expense and needs its own breakdown by department. Prime cost — the sum of food cost and labor as a percentage of revenue — is the single number most operators watch most closely. Industry rule of thumb: prime cost should stay below 65% for full-service restaurants and below 60% for fast-casual.
Restaurant Industry at a Glance
Financial templates built for restaurants — from fast-casual to fine dining. Pre-loaded with food cost categories, labor splits, and industry-standard KPIs.
Revenue Drivers
- Dine-in sales
- Takeout & delivery
- Catering
- Alcohol sales
Key Cost Categories
- Food costs (COGS)
- Labor
- Rent & occupancy
- Utilities
- Marketing
- Equipment & maintenance
Typical Margins
Gross: 60-70% · Net: 3-9%
Seasonality
Higher revenue in summer and holiday seasons; January-February typically slowest months.
Key Performance Indicators
Restaurant Income Statement Template FAQ
More Restaurant Templates
Restaurant Balance Sheet Template for Excel
$29
Restaurant Budget Template for Excel
$29
Restaurant Business Plan Template for Excel
$39
Restaurant Cash Flow Template for Excel
$29
Restaurant Expense Tracker Template for Excel
$29
Restaurant Financial Model Template for Excel
$29
Restaurant Invoice Template for Excel
$29
Restaurant KPI Dashboard Template for Excel
$29
Restaurant P&L Template for Excel
$29
Restaurant Pro Forma Template for Excel
$29
Restaurant Project Budget Template for Excel
$29
Restaurant Sales Forecast Template for Excel
$29
Restaurant Valuation Template for Excel
$29
More Income Statement Templates
Accounting Firm Income Statement Template for Excel
$29
Auto Repair Income Statement Template for Excel
$29
Car Wash Income Statement Template for Excel
$29
Church Income Statement Template for Excel
$29
Cleaning Service Income Statement Template for Excel
$29
Coffee Shop Income Statement Template for Excel
$29
Restaurant Income Statement Template
$29