Restaurant P&L Template
Track your restaurant's revenue, food costs, labor, and net income with a P&L template built for food service — not a generic spreadsheet you have to restructure from scratch.
What's Inside This Restaurant P&L Template
This template includes 4 worksheets, each designed for a specific part of your restaurant financial workflow:
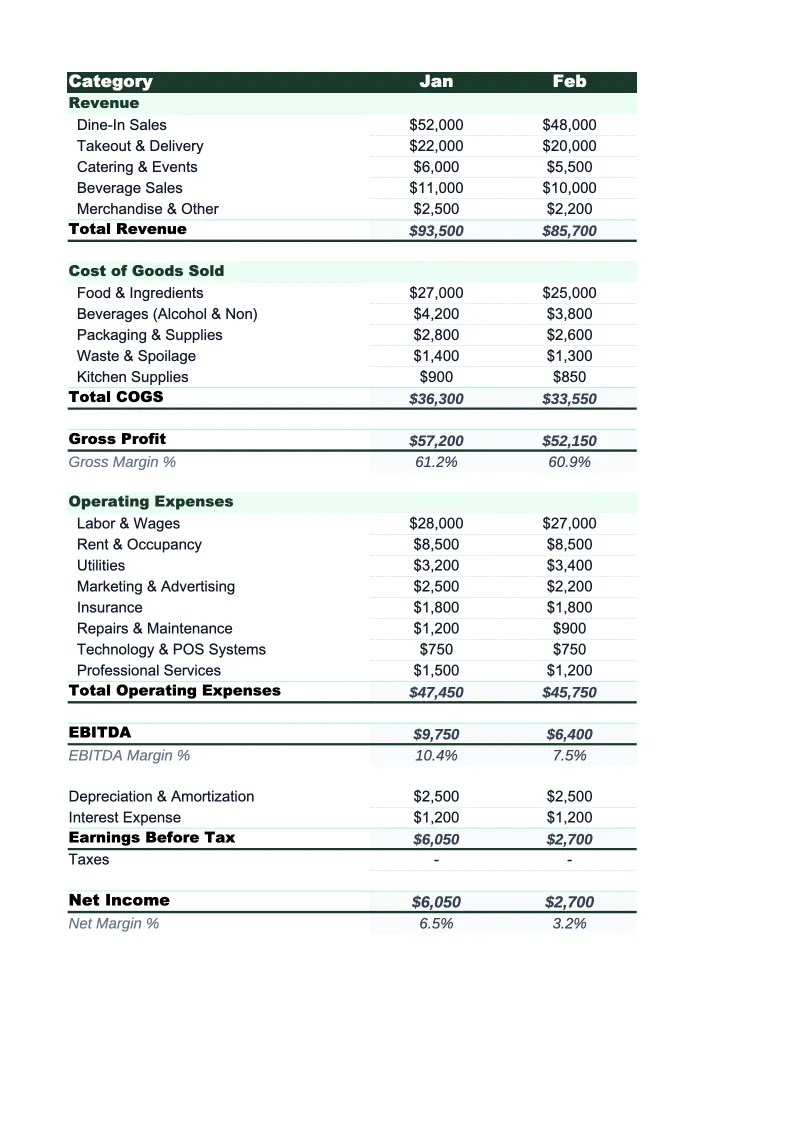
Monthly P&L
The main worksheet where you record each month's revenue and expenses.
Annual P&L
A 12-month view that pulls from the Monthly P&L sheet automatically.
Food Cost Analysis
A dedicated worksheet for tracking food and beverage costs in detail.
Dashboard
A one-page visual summary with pre-built charts and key financial metrics.
Restaurant P&L Template Features
- Revenue split by channel: dine-in, takeout, delivery, catering, and alcohol
- Food cost breakdown by category with percentage calculations
- Labor split by front-of-house, back-of-house, and management
- Gross margin and net income auto-calculated every month
- 12-month annual P&L view with full-year totals
- Visual dashboard with food cost %, labor cost %, and margin trends
How to Use This Restaurant P&L Spreadsheet
Download the .xlsx file and open it in Excel or Google Sheets — no macros, no plugins, no setup beyond entering your numbers. Start with the Monthly P&L sheet. Review the pre-loaded revenue and expense categories: most restaurants can go live with 80–90% of them unchanged. Rename any categories that don't match your setup (for example, if you don't serve alcohol, remove that revenue line and replace it with something relevant). The whole first-time setup typically takes 15–20 minutes.
Once the structure is set, enter your monthly revenue and expense figures. Pull numbers from your POS system's monthly sales report and your accounting software or bank statements for expenses. The food cost analysis sheet is worth filling out separately: enter your purchases by category each month and it will calculate your food cost percentage automatically, broken down by protein, produce, dairy, dry goods, and beverage. This is where most operators find the most actionable insight in the first few months.
15 minutes from download to your first P&L
Download the template, enter last month's numbers, and see your restaurant's gross margin and net income — with food cost and labor percentages calculated automatically.
Why Every Restaurant Needs a P&L Template
Restaurants operate on some of the thinnest margins in any industry — typically 3–9% net profit on every dollar of revenue. At those margins, a 2-point rise in food cost percentage or an unbudgeted repair bill can turn a profitable month into a loss. Most restaurant owners know this intellectually, but without a structured P&L to review each month, the numbers stay abstract until it's too late to do anything about them. A P&L template turns financial data from a quarterly surprise into a monthly management tool.
A restaurant P&L has a specific structure that generic templates don't reflect. Revenue needs to be broken out by channel — dine-in, takeout, delivery, catering, and alcohol behave differently and have different margin profiles. COGS should separate food from beverage, not lump them together as 'cost of goods.' Labor needs to distinguish front-of-house from back-of-house because they scale differently: FOH labor rises and falls with covers, while BOH labor is relatively fixed. When these categories are set up correctly, the P&L shows you not just whether the restaurant is profitable, but which parts of the business are pulling their weight.
Restaurant Industry at a Glance
Financial templates built for restaurants — from fast-casual to fine dining. Pre-loaded with food cost categories, labor splits, and industry-standard KPIs.
Revenue Drivers
- Dine-in sales
- Takeout & delivery
- Catering
- Alcohol sales
Key Cost Categories
- Food costs (COGS)
- Labor
- Rent & occupancy
- Utilities
- Marketing
- Equipment & maintenance
Typical Margins
Gross: 60-70% · Net: 3-9%
Seasonality
Higher revenue in summer and holiday seasons; January-February typically slowest months.
Key Performance Indicators
Restaurant P&L Template FAQ
More Restaurant Templates
Restaurant Balance Sheet Template for Excel
$29
Restaurant Budget Template for Excel
$29
Restaurant Business Plan Template for Excel
$39
Restaurant Cash Flow Template for Excel
$29
Restaurant Expense Tracker Template for Excel
$29
Restaurant Financial Model Template for Excel
$29
Restaurant Income Statement Template for Excel
$29
Restaurant Invoice Template for Excel
$29
Restaurant KPI Dashboard Template for Excel
$29
Restaurant Pro Forma Template for Excel
$29
Restaurant Project Budget Template for Excel
$29
Restaurant Sales Forecast Template for Excel
$29
Restaurant Valuation Template for Excel
$29
Restaurant P&L Template
$29