Veterinary Pricing Guide: How to Price Your Practice Profitably
How veterinary practices should price exams, procedures, and medications — covering cost-based rate setting, pharmaceutical markup, wellness plans, and the metrics that matter.
A busy veterinary practice with full exam rooms, a loyal client base, and a skilled team should be making money. Many aren't — not because of volume, but because their fee schedule was set years ago and hasn't kept pace with costs.
Veterinary care costs rose 9.8% in 2024 while general inflation ran 3.2%, according to Bureau of Labor Statistics data. Wages, pharmaceutical costs, and facility overhead have all climbed steeply since 2019. A practice using the same pricing from five years ago is almost certainly operating with compressed margins — or none at all.
Getting pricing right requires understanding what each service actually costs, what the market will bear, and how to structure your fee schedule so that it covers overhead and produces a real return.
The Cost Structure Behind a Veterinary Exam Fee
The exam fee is the most visible number clients see, and it's often the one practices underprice the most. Setting it requires working backward from your actual costs.
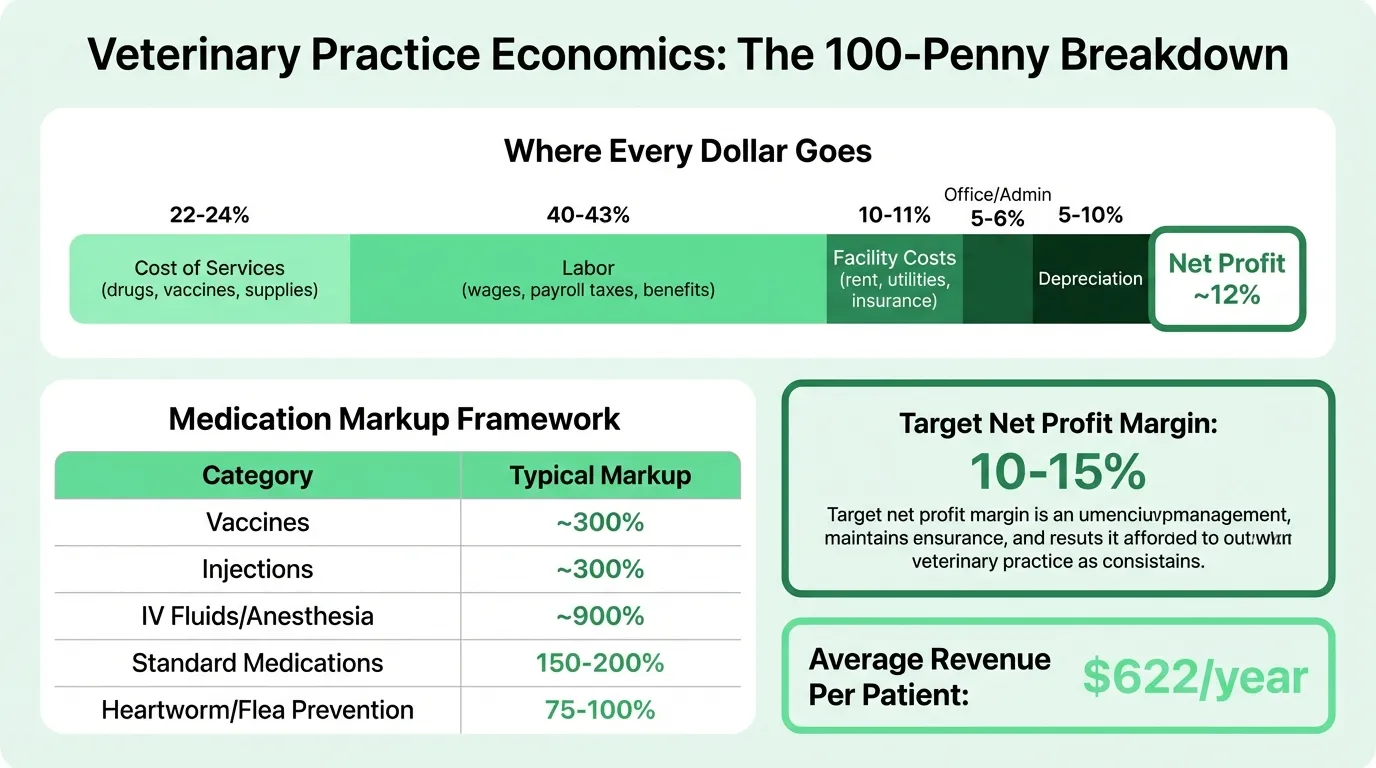
The "100-penny breakdown" — how a well-run general practice allocates each dollar of revenue — looks like this:
| Expense Category | % of Gross Revenue |
|---|---|
| Cost of professional services (drugs, vaccines, supplies) | 22–24% |
| Labor (wages, payroll taxes, benefits — all staff) | 40–43% |
| Facility costs (rent, utilities, insurance) | 10–11% |
| Office and admin (marketing, accounting, software) | 5–6% |
| Depreciation (equipment, imaging) | 5–10% |
| Net profit | ~12% |
Every dollar of revenue is already spoken for before profit appears. An exam fee that doesn't reflect this cost structure produces a visit that costs more to deliver than it earns.
Building your exam fee from the ground up
Step 1: Calculate loaded staff cost per hour. A veterinarian or technician's wage isn't the full cost. Add employer payroll taxes (7.65%), workers' compensation, health benefits, and paid time off, and the true employment cost rises roughly 25–30% above base pay. A vet earning $90/hour costs the practice $112–$117/hour to employ.
Step 2: Estimate time per exam. A complete wellness exam with charting and client communication typically takes 25–35 minutes of veterinarian time plus 15–20 minutes of technician time. Work out the loaded cost per exam based on those time allocations.
Step 3: Add overhead. The facility costs, admin, and equipment depreciation above need to be recovered from every billable service. Divide your total annual overhead (excluding labor and COGS) by your projected exam volume. This per-exam overhead allocation needs to show up in your fee.
Step 4: Add target margin. Divide the sum of labor and overhead by (1 − target margin). For a 15% net margin target: Break-even cost ÷ 0.85. That's your floor price before any competitive positioning.
The AVMA's 2024 data shows average revenue per veterinarian per hour running at $288, and revenue per exam room per year at $444,668. These benchmarks help you check whether your pricing and capacity utilization are in range — or whether you're generating less per hour than your cost structure requires.
Medication and Pharmaceutical Pricing
Pharmaceuticals represent 22–24% of gross revenue in a well-run practice. Get the markup wrong in either direction and the whole cost structure suffers.
Standard markup framework
The base approach is to price medications at 150% above cost (including tax and shipping). But a single flat markup misses the economics of different product categories. The industry norm is a tiered structure:
| Product Category | Typical Markup |
|---|---|
| Vaccines | ~300% |
| Injections and infusibles | ~300% |
| IV fluids and anesthesia | ~900% |
| Standard prescription medications | 150–200% |
| Heartworm/flea/tick preventives | 75–100% |
| Slow-moving drugs (long shelf life) | 200–275% |
The lower markups on preventives reflect competitive pressure from online pharmacies and big-box retailers. If your heartworm prevention pricing is significantly above what clients can find online, you'll lose those sales — and the client relationship that comes with the dispensing conversation.
Higher-markup categories like anesthesia and IV fluids carry 900% because the handling, monitoring, waste, and clinical risk involved are significant. The percentage looks large; the economics justify it.
Dispensing fees
A dispensing fee — charged per prescription filled regardless of the medication — covers staff time for labeling, counting, packaging, client education, and regulatory compliance. The industry standard is $9–$15 for a full prescription fill, or $3–$6 for a label-only fee when no counting is required.
Practices that skip dispensing fees are effectively subsidizing their pharmacy operations with margin from other services. If you're filling 20–30 prescriptions per day at no dispensing fee, that's $180–$450 in daily unbilled labor and overhead.
Markup vs. margin: the formula matters
Many practices price pharmaceuticals using a markup percentage when they mean a margin target. These are not the same:
- A 50% markup on a $100 drug yields a $150 selling price — but a 33% gross margin
- To hit 50% gross margin, you need a 100% markup on cost
The correct formula to price for a specific margin: Selling Price = Cost ÷ (1 − Target Margin)
For a 45% gross margin on a $60 medication: $60 ÷ 0.55 = $109.09. Using markup percentages when you intend margin targets consistently underprices products — especially on higher-cost items where the dollar difference is material. The veterinary markup calculator handles the conversion across your full formulary.
Wellness Plans vs. À La Carte
Wellness plans convert preventive care from sporadic, event-driven visits into predictable recurring revenue. The financial case is strong when plans are structured correctly.
AVMA journal data shows wellness plan members visit an average of 5.5 times per year versus 3.3 for non-members — 67% more frequent visits. Revenue per patient for plan members is typically 50–200% higher annually. Practices with wellness plans report 38% higher client retention.
Pricing wellness plans
The standard approach is to bundle services at 15–20% below their à la carte total. This gives clients a tangible savings reason to enroll while keeping the plan economics viable for the practice.
Two factors that make wellness plan pricing tricky:
Utilization (breakage). The average wellness plan member uses approximately 70% of available services. Plans priced at a deep discount that assume 100% utilization will be profitable — the other 30% in unused services is margin recovery. Plans discounted more than 20% that are also used at 90%+ become margin-negative.
Mix of services. If your plan bundles high-margin services (dentals, bloodwork) and clients use those consistently, the economics shift unfavorably. Audit utilization by service line before setting plan pricing.
A common mistake: pricing wellness plans at 35–40% discounts off à la carte as a client acquisition strategy. At that discount level with average utilization, the math usually doesn't work. Price the plan to serve the client and sustain the practice — not to win on a price comparison.
Need a ready-made budget template for your veterinary?
Download a pre-built spreadsheet with industry-specific categories, formulas, and formatting.
Common Pricing Mistakes
Not knowing your overhead rate. You cannot know whether a fee covers costs if you don't know what your overhead costs. Add up annual fixed costs, divide by projected revenue or exam volume, and check whether that number is in your fee schedule. The veterinary break-even calculator shows exactly how many exams per month your fee schedule needs to support.
Relying on outdated markups. Pharmaceutical costs, supplier prices, and wage rates change continuously. A markup set in 2020 on products that cost 30% more today now generates 30% less gross margin. Update cost inputs when new inventory arrives.
Not charging for technician time. Tech-only appointments — blood pressure checks, laser therapy, sample collection, medication education, suture removals — represent real labor cost and clinical skill. These are frequently unbilled or folded into exam fees. Each one should be a line item.
Setting rates based on competitors, not costs. If the practice down the street charges $85 for an exam and your cost structure requires $110, charging $85 to stay competitive is a guaranteed path to margin erosion. Competitors may also be losing money at $85.
Infrequent fee schedule reviews. Practices that wait three or four years between fee updates face two problems: a larger increase becomes necessary all at once, which generates significant client friction. Small annual increases of 3–5% are absorbed far better than a sudden 15–20% jump.
Bundling diagnostics into exam fees. Running bloodwork, urinalysis, or in-house testing at no additional charge makes the practice appear less expensive but actually destroys margin on diagnostics. Each diagnostic service has a cost and should be billed separately.
The Metrics to Track
Pricing decisions improve through feedback. Track these numbers regularly:
Revenue per patient (annual). The AVMA/Vetsource benchmark is $622/year. If your practice is significantly below this, examine visit frequency and average invoice size — one or both are likely underperforming.
COGS as a percentage of gross. Target: 20–24%. If pharmaceutical and supply costs consistently exceed 27–30%, the markup structure needs review. This is one of the most reliable indicators of pricing health.
Gross profit margin by service category. Track labor gross margin and pharmaceutical gross margin separately. A blended number masks which category is the problem.
Average invoice value. Not just what the practice charges — what clients actually pay. Declining average invoices on similar case types often indicate discounting, price erosion, or clients declining more recommendations.
Effective hourly rate per veterinarian. Revenue ÷ hours worked. The AVMA 2024 figure is $288/hour nationally. If your effective rate is materially below this benchmark, pricing, utilization, or case mix warrants a closer look. The veterinary profit margin calculator lets you check how fee changes affect your overall practice margin.
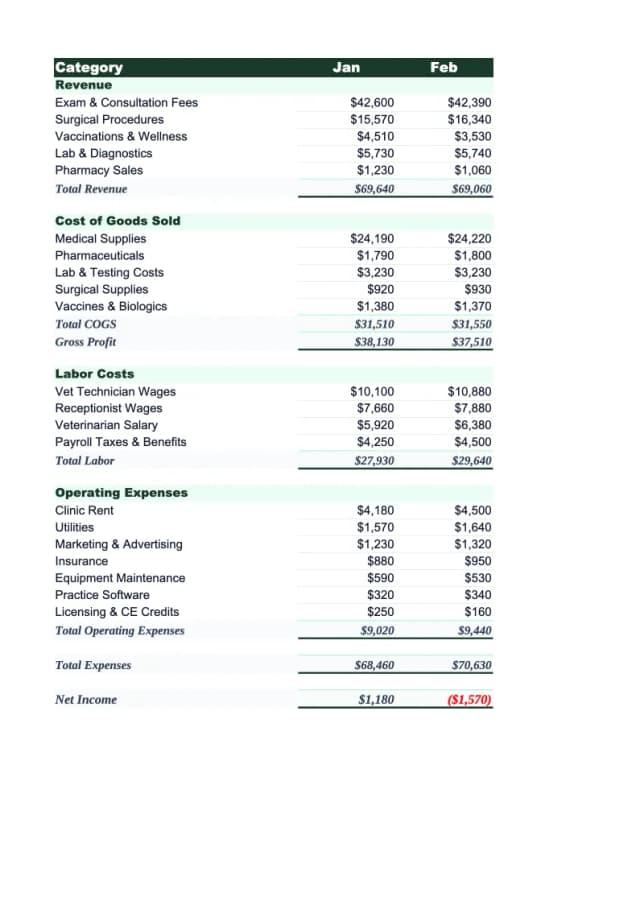
A structured P&L gives you the clearest view of where margin is being made and lost. The Veterinary P&L Template is organized around the revenue and expense categories that matter in a veterinary practice — professional services, pharmaceuticals, staff costs, and overhead — so you can see gross margin by category rather than just overall profit. For annual planning, the Veterinary Budget Template helps you set revenue targets, headcount plans, and expense limits against realistic cost benchmarks.
The Right Starting Point
If you're uncertain whether your current fees are covering costs, start with two numbers: your total annual overhead and your actual billable exam volume. Divide one by the other. That's your overhead per exam. Add your loaded staff cost per exam and your target margin. Compare the result to what you're charging.
Most practices that run this exercise for the first time find a gap — usually between what they're charging and what they need to charge to sustain the business. Finding the gap early, when it can be closed with annual increases of 3–5%, is far better than finding it when it requires a conversation about the practice's viability. For a complete picture of your practice's financial position, the Veterinary Income Statement Template gives you a structured view of revenue, cost of services, and profitability by month and year.
Last updated: March 25, 2026
Frequently Asked Questions
Related Articles
Auto Repair Pricing Guide: How to Price Your Shop Profitably
How auto repair shop owners should price labor and parts — covering labor rate calculation, flat-rate hours, parts markup matrices, diagnostic fees, and the metrics that matter.
Cleaning Service Pricing Guide: How to Price Your Business Profitably
A practical guide to cleaning service pricing — covering hourly vs. flat rate vs. per square foot models, price benchmarks by service type, labor cost math, and the common mistakes that keep cleaning businesses from hitting their margin targets.
Construction Pricing Guide: How to Price Your Work Profitably
How contractors should price construction work — covering labor burden, overhead recovery, material markup, pricing methods, and the mistakes that quietly erode margin.
Electrical Pricing Guide: How to Price Your Work Profitably
How electricians and electrical contractors should price their work — covering hourly rates, flat-rate pricing, overhead recovery, material markup, and common mistakes that erode margin.
Hotel Sales Forecast: A Practical Example and Guide
How to build a hotel sales forecast — covering rooms, F&B, events revenue, key metrics like RevPAR and ADR, booking pace, and the rolling forecast structure that keeps you ahead.
Landscaping Pricing Guide: How to Price Your Work Profitably
A practical guide to landscaping pricing — covering hourly rates, per-square-foot benchmarks, overhead recovery, and the markup math that determines whether you're making money.