Veterinary P&L Template
Track profitability for your veterinary practice with a P&L built around service mix, pharmacy margins, DVM productivity, and the cost benchmarks that clinic owners and practice managers actually use.
What's Inside This Veterinary Practice P&L Template
This template includes 5 worksheets, each designed for a specific part of your veterinary financial workflow:
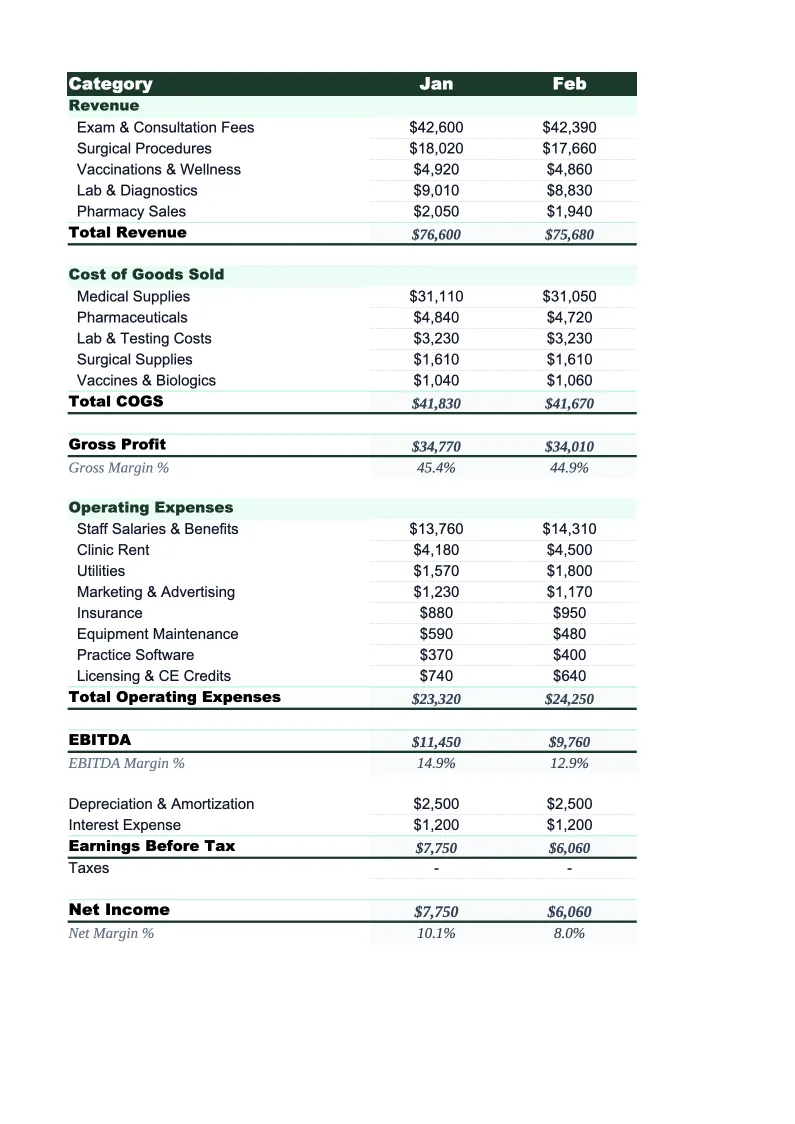
Monthly P&L
The core worksheet where you record each month's revenue and expenses across the categories that drive veterinary practice profitability.
Annual Summary
A 12-month rollup that pulls from each monthly P&L tab automatically.
Service Mix Analysis
Tracks revenue, COGS, and gross margin for each service category — wellness, sick visits, surgery, dentistry, pharmacy, diagnostics, and boarding — on a monthly basis.
DVM Productivity
Tracks revenue and key productivity metrics per doctor — each full-time and part-time DVM on staff — alongside their direct compensation and benefit costs.
Dashboard
A one-page visual summary with pre-built charts for monthly revenue trends, COGS percentage over time, service mix breakdown, and staff cost as a percentage of revenue.
Veterinary Practice P&L Template Features
- Revenue tracked by service line: wellness, sick visits, surgery, dentistry, pharmacy, diagnostics, and boarding
- COGS tracked separately for pharmaceuticals, medical supplies, and outside lab fees
- Service Mix Analysis sheet with gross margin percentage per service category
- DVM Productivity tracker with revenue per doctor, ACT, and compensation ratios
- COGS percentage and staff payroll percentage calculated monthly against industry benchmarks
- Dashboard with charts for revenue trends, service mix, and key KPI summary
How to Use This Veterinary Practice P&L Spreadsheet
Download the .xlsx file and open it in Excel or Google Sheets. Start with the Monthly P&L tab: review the pre-loaded service categories and expense line items and adjust them to match your practice's chart of accounts. Most clinics keep the structure as-is and add or rename a few lines — for example, separating feline and canine surgery if you track those independently, or adding a line for specialty referral revenue if you have in-house specialists. Initial setup takes about 15 minutes, and you'll only do it once.
Once the categories look right, pull your revenue figures from your practice management software — Avimark, Cornerstone, Impromed, eVetPractice, or whichever system you use. Most generate a revenue-by-category report that maps directly to the service lines in the Monthly P&L tab. Enter COGS from your pharmacy and supply invoices or your inventory system. Then enter operating expenses from your accounting software or bank statements. The sheet calculates gross margin, COGS percentage, and net income automatically. Fill in the DVM Productivity sheet using the provider production reports your PM software generates.
15 minutes from download to your first P&L
Download the template, enter your revenue by service category and expenses from your PM software, and see your veterinary practice's full financial picture — monthly P&L, service mix, and DVM productivity included.
Why Every Veterinary Practice Needs a P&L Template
Veterinary practices have a financial structure that generic P&L templates handle poorly. Revenue comes from multiple service lines — exams, surgery, pharmacy, diagnostics, dentistry — with dramatically different cost profiles. A wellness exam generates 85–90% gross margin; pharmacy dispensing generates 40–55%; a surgical procedure sits somewhere in between depending on supply costs and anesthesia. If your P&L shows only total revenue and total COGS, you have no way of knowing whether your practice's gross margin is where it should be or why it's moving. A 74–78% gross margin is typical for a well-run general practice, but the same number could mean your exam volume is strong and your pharmacy margins are healthy, or it could mean you're over-relying on high-margin exams while undercharging for surgery. The service mix view changes what you can act on.
On the cost side, the two numbers that matter most to veterinary practice profitability are COGS as a percentage of revenue and staff payroll as a percentage of revenue. COGS covers medications, vaccines, supplies, and outside lab fees — the benchmark is 22–26% for most small animal practices, with mixed or large animal practices running somewhat higher due to drug and supply volumes. Staff payroll typically runs 40–45% for a full-service small animal clinic. Together, these two categories represent roughly 65–70% of revenue, leaving about 30–35% to cover rent, equipment, software, insurance, and net income. When practices struggle financially, it's almost always because one or both of these ratios have crept up — and without monthly tracking, the drift is invisible until it's compounded into a serious problem.
Veterinary Industry at a Glance
Financial templates built for veterinary practices — from small animal clinics to multi-location hospitals. Pre-loaded with exam, surgery, pharmacy, and diagnostic categories.
Revenue Drivers
- Wellness exams and preventive care
- Surgical procedures
- Pharmacy and medication sales
- Diagnostics and lab work
- Dental procedures
- Emergency and urgent care
Key Cost Categories
- Medications and pharmaceuticals (COGS)
- Medical and surgical supplies
- Veterinarian salaries
- Technician and support staff wages
- Facility rent and utilities
- Diagnostic equipment and lab fees
Typical Margins
Gross: 74-78% · Net: 10-15%
Seasonality
Spring and fall peaks for wellness visits and heartworm testing; summer uptick in emergency visits; relatively stable year-round compared to many industries.
Key Performance Indicators
Veterinary Practice P&L Template FAQ
More Veterinary Templates
Veterinary Practice Balance Sheet Template for Excel
$29
Veterinary Budget Template for Excel
$29
Veterinary Business Plan Template for Excel
$39
Veterinary Practice Cash Flow Template for Excel
$29
Veterinary Expense Tracker Template for Excel
$29
Veterinary Practice Financial Model Template for Excel
$29
Veterinary Income Statement Template for Excel
$29
Veterinary Invoice Template for Excel
$29
Veterinary Practice KPI Dashboard Template for Excel
$29
Veterinary Pro Forma Template for Excel
$29
Veterinary Project Budget Template for Excel
$29
Veterinary Sales Forecast Template for Excel
$29
Veterinary Practice Valuation Template for Excel
$29
Veterinary P&L Template
$29