Restaurant Cash Flow Example: Real Numbers, Real Format
A complete restaurant cash flow example with real benchmark numbers — monthly statement, weekly view, and what each line actually means for your operation.
Here's what a restaurant cash flow statement actually looks like — with real numbers based on 2024 industry benchmarks, not sanitized round figures.
The example below is a casual dining restaurant doing $1.2M in annual revenue ($100,000/month). Use it to benchmark your own operation, understand the format your accountant and lender expect, and spot the line items most operators miss.
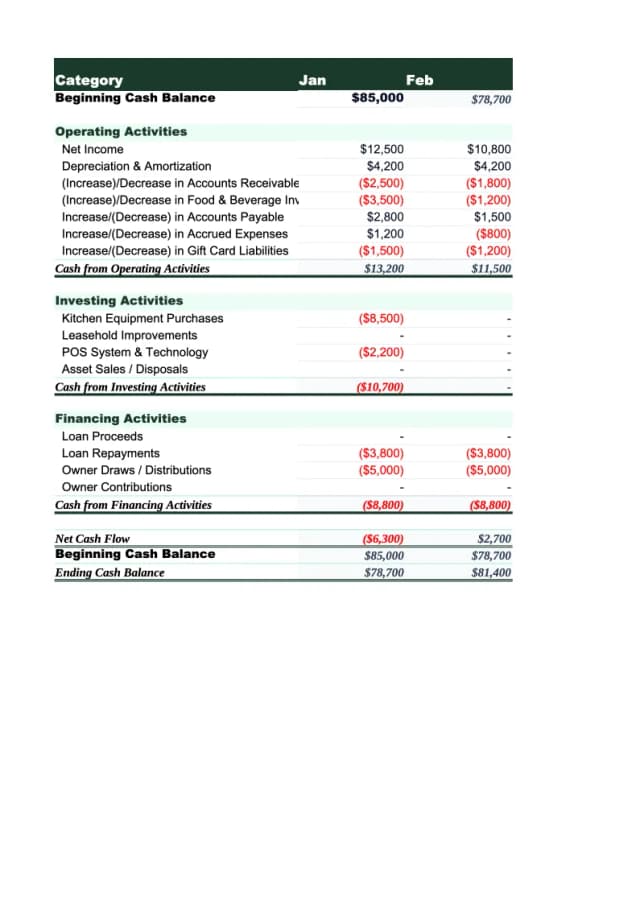
The Monthly Cash Flow Statement
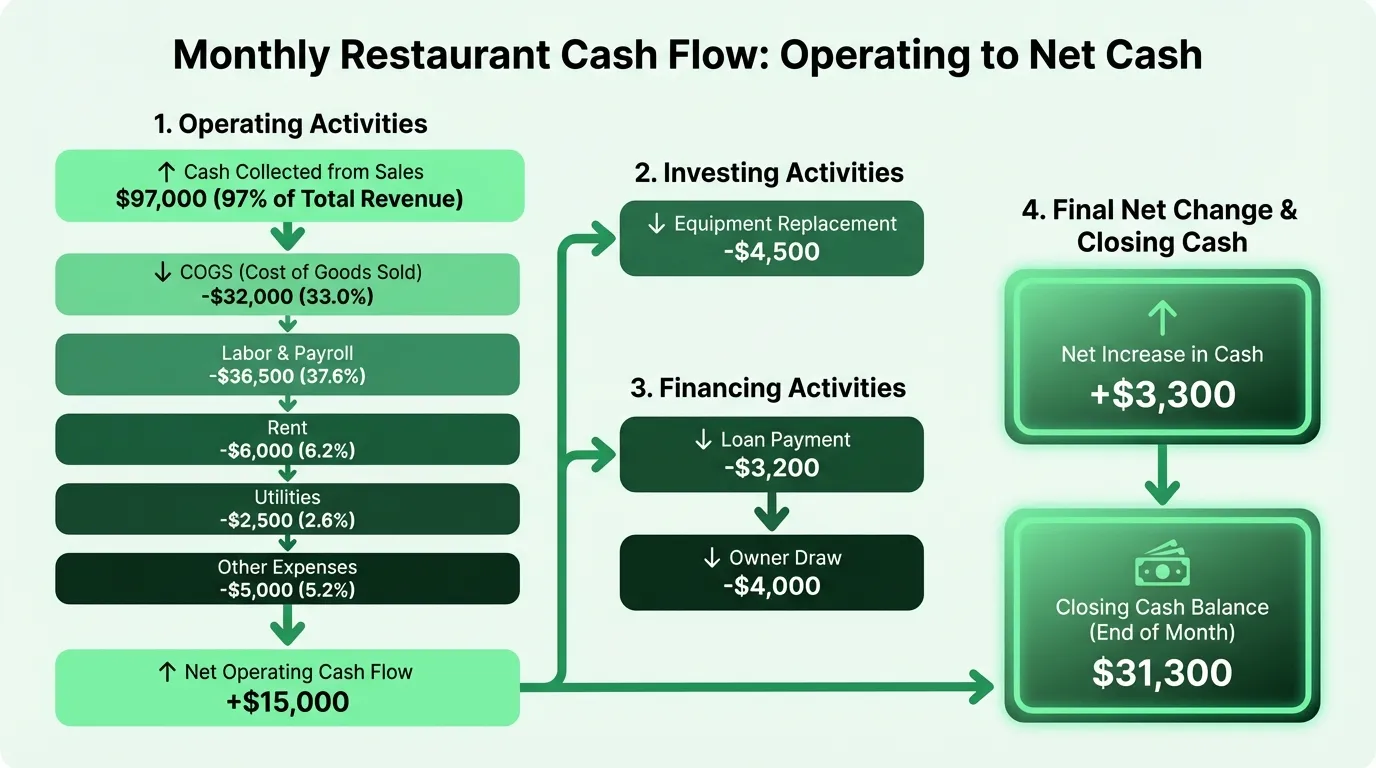
This is the format banks and investors ask for — three sections, each showing a different type of cash movement.
Operating Activities
| Line Item | Monthly Amount | % of Revenue |
|---|---|---|
| Food & beverage sales | $100,000 | 100% |
| Credit card settlement timing adjustment | -$3,000 | — |
| Cash collected from customers | $97,000 | — |
| Food & beverage cost (COGS) | -$32,000 | 32% |
| Labor — wages, payroll taxes, benefits | -$36,500 | 36.5% |
| Rent & occupancy | -$6,000 | 6% |
| Utilities | -$2,500 | 2.5% |
| Credit card processing fees | -$2,000 | 2% |
| Supplies & smallwares | -$1,000 | 1% |
| Repairs & maintenance | -$800 | 0.8% |
| Marketing & delivery platform fees | -$1,200 | 1.2% |
| Net Operating Cash Flow | +$15,000 | 15% |
Investing Activities
| Line Item | Monthly Amount |
|---|---|
| Replacement equipment (walk-in repair) | -$4,500 |
| Net Investing Cash Flow | -$4,500 |
Financing Activities
| Line Item | Monthly Amount |
|---|---|
| SBA loan repayment | -$3,200 |
| Owner draw | -$4,000 |
| Net Financing Cash Flow | -$7,200 |
Net Change in Cash: +$3,300
Opening cash balance: $28,000 Closing cash balance: $31,300
This restaurant is running well. Operating cash flow covers debt service, owner draw, and equipment with room to spare. That $31,300 ending balance represents about 9 days of revenue — adequate, but tighter than the 14–21 days most operators target.
How This Compares to Industry Benchmarks
The numbers in the example above are built from 2024 NRA data on 900+ restaurant operators. Here's how the key cost lines stack up:
| Cost Category | This Example | NRA 2024 Median | Target Range |
|---|---|---|---|
| Food cost | 32.0% | 32.0% | 28–34% |
| Labor cost | 36.5% | 36.5% | 30–38% |
| Prime cost | 68.5% | 68.5% | 60–65% |
| Occupancy | 6.0% | 5.7% | 5–8% |
| Net operating margin | 15.0% | varies | 8–15% |
Prime cost — food plus labor — is the number that drives cash flow more than anything else. In 2024, the median full-service restaurant ran a prime cost of 68.5%, above the 60–65% target range. That's why so many restaurants show adequate revenue but thin cash flow.
If your prime cost is above 68%, focus there before anything else. A 2-point improvement in food cost on $1.2M in revenue is $24,000 annually — the difference between a comfortable cash position and a perpetually tight one. The restaurant profit margin calculator shows how a shift in food cost flows through to your bottom line.
The Weekly Cash Flow View
The monthly statement is for lenders. The weekly view is for operators. Here's what one typical week looks like for the same restaurant:
| Day | Cash In | Cash Out | Daily Net |
|---|---|---|---|
| Monday | $2,800 (CC settlements from Sat-Sun) | $4,200 (produce, vendor) | -$1,400 |
| Tuesday | $1,900 (Mon CC) | $9,500 (broadline distributor invoice) | -$7,600 |
| Wednesday | $2,100 (Tue CC) | $1,200 (supplies) | +$900 |
| Thursday | $2,400 (Wed CC) | $18,500 (bi-weekly payroll) | -$16,100 |
| Friday | $6,800 (Thu-Fri CC, strong weekend) | $2,800 (beverage delivery) | +$4,000 |
| Saturday | $8,200 (Sat CC) | $3,100 (produce, dairy) | +$5,100 |
| Sunday | $4,100 (Sun CC) | $0 | +$4,100 |
| Weekly Total | $28,300 | $39,300 | -$11,000 |
Wait — that's a negative weekly cash flow despite $28,300 coming in. That's the timing problem. Thursday's payroll run ($18,500) hits before the weekend revenue settles. By end of week, the bank balance has dropped $11,000 even though the month will end positive.
This is why operators who only look at monthly statements get blindsided. The monthly number looks fine. The mid-week bank balance can look alarming. Pairing the weekly cash view with a restaurant budget example helps you see where the monthly targets diverge from actual weekly cash movement.
The fix isn't to change your payroll schedule — it's to keep enough cash in reserve to absorb these weekly swings without panic. For this restaurant, holding $25,000–$35,000 as a minimum balance covers any single week's timing gap.
Need a ready-made cash flow template for your restaurant?
Download a pre-built spreadsheet with industry-specific categories, formulas, and formatting.
The Three Lines That Determine Cash Flow Health
Every restaurant cash flow statement comes down to three numbers:
1. Prime cost percentage (Food cost + Labor cost) ÷ Revenue. Target: below 65%. Above 70% means you're generating very little cash even with healthy revenue.
2. Operating cash flow margin Net operating cash flow ÷ Revenue. A healthy casual dining restaurant should be in the 8–15% range. Below 5% means you're vulnerable to any disruption — one bad week, one equipment failure, one slow month.
3. Days of cash on hand Cash balance ÷ (Monthly expenses ÷ 30). This tells you how long you can operate if revenue stops. Industry guidance is 14–30 days minimum. Under 14 days is fragile; under 7 days is genuinely dangerous.
For the example above: $31,300 cash ÷ ($85,000 monthly expenses ÷ 30) = 11 days of cash. That's functional, but the operator should be building toward 20+ days.
What Shows Up in the Cash Flow That Your P&L Hides
Your profit and loss statement shows revenue minus expenses. It doesn't show timing. It doesn't show debt repayment. And it doesn't show equipment replacement.
Three things that only appear in cash flow:
Loan repayments. The SBA loan repayment in the example above is $3,200/month. That $3,200 doesn't appear on your P&L as an expense — only the interest portion does. But all $3,200 leaves your bank account every month.
Owner draws. If you're pulling $4,000/month out of the business, that doesn't reduce your reported profit. But it absolutely reduces your cash balance.
Equipment purchases. Replacing that walk-in refrigerator compressor for $4,500 hits the cash flow statement immediately, but your P&L spreads the depreciation over 5–7 years at $50–$80/month. On the day you pay it, $4,500 leaves the bank.
This is why looking at your P&L and thinking "we made money this month" can be misleading. The cash flow statement shows what actually happened to your bank account.
Setting Up Your Own Cash Flow Tracker
You don't need accounting software for this. A spreadsheet with these sections handles it:
Monthly view (for lenders and planning):
- Revenue by source (dine-in, takeout, delivery, catering, alcohol)
- Operating expenses by category with actual vs. budget
- Investing activities (equipment, renovations)
- Financing activities (loans, draws)
- Opening and closing cash balance
Weekly rolling projection (for operations):
- 13 weeks forward, updated every Monday
- Revenue as a function of day-of-week patterns
- Vendor payment due dates mapped to the week they'll hit
- Payroll run dates marked
- Minimum cash threshold flagged
The Restaurant Cash Flow Template has both views built in, with formulas calibrated to restaurant-specific timing. If you're also tracking profitability, pair it with the Restaurant P&L Template — the cash flow statement and P&L together give you the full financial picture your accountant and lender need.
The Seasonal Adjustment
The example above uses a flat $100,000/month. Real restaurants don't work that way.
A restaurant doing $1.2M annually might look like this across 12 months:
| Month | Revenue | % of Average |
|---|---|---|
| January | $72,000 | 72% |
| February | $78,000 | 78% |
| March | $92,000 | 92% |
| April | $98,000 | 98% |
| May | $108,000 | 108% |
| June | $112,000 | 112% |
| July | $105,000 | 105% |
| August | $98,000 | 98% |
| September | $95,000 | 95% |
| October | $102,000 | 102% |
| November | $110,000 | 110% |
| December | $130,000 | 130% |
January and February cash flows look completely different than the example above — with $72,000 in revenue but the same fixed costs, operating cash flow could drop to near zero or negative. The December surplus needs to fund those winter months.
Operators who build cash reserves in strong months survive weak ones. Those who spend every dollar of a good December find themselves arranging emergency credit in February. Use the restaurant cash flow calculator to model how seasonal swings affect your ending cash balance across the year.
For a deeper look at projections, cash reserve planning, and vendor timing, see the restaurant cash flow management guide — it covers the weekly review process and how to act on what the numbers show.
Last updated: March 23, 2026
Frequently Asked Questions
Related Articles
Construction Cash Flow Example: How It Actually Works
A real-world construction cash flow example showing how retainage, draw schedules, and payment delays create cash gaps — and how to plan around them.
Hotel Cash Flow Example: Why Occupancy Doesn't Equal Cash
A real hotel cash flow example covering OTA commission timing, advance deposits, RevPAR gaps, and how to build a projection that prevents off-season surprises.
How to Manage Restaurant Cash Flow (Without Losing Sleep)
A practical guide to restaurant cash flow management — covering the timing mismatches, seasonal swings, and vendor payment cycles that catch operators off guard.