Restaurant Budget Example: Line Items, Benchmarks, and What to Include
A practical restaurant budget example with real industry benchmarks — covering food cost, labor, occupancy, and the line items most operators underestimate.
A restaurant budget that doesn't match how the business actually operates is just a spreadsheet full of optimistic guesses. The useful version has the right categories, realistic benchmarks, and a structure you can compare against actual results every month.
This is what a restaurant budget actually looks like — with the line items that matter and the industry benchmarks to calibrate them.
Annual Budget vs. Monthly Budget
Most restaurants need both.
An annual budget sets the full-year target: total revenue, total costs by category, and the profit margin you're aiming for. It's the document you use to make annual decisions — how many staff to hire, what rent you can afford, whether to launch a catering program.
A monthly budget breaks the annual plan into twelve unequal slices. If your annual revenue target is $1.4M, you don't budget $116,667 in January and $116,667 in December — January might do $90,000 while December does $160,000. A monthly budget built around your historical seasonality is what you actually compare against each month's P&L.
Build the annual budget first, then distribute revenue and variable costs by month based on prior-year seasonality or industry patterns for your region and concept type.
The Core Budget Categories
Revenue
Track revenue by type, not just as a single total:
- Food sales — dine-in and takeout food orders
- Alcohol and beverage sales — tracked separately because margins and cost percentages differ significantly
- Catering and private events — often higher margin, different cost structure
- Delivery revenue — if using third-party platforms, note the net amount after platform fees, or track gross and deduct fees separately
Cost of Goods Sold (COGS)
Food and beverage cost is the starting point for any restaurant budget analysis.
According to the National Restaurant Association's 2025 Operations Data Abstract (based on data from 900+ operators covering fiscal year 2024):
| Concept Type | Median Food Cost % |
|---|---|
| Full-service restaurants | 32.0% |
| Limited-service restaurants | 32.4% |
| Full-service, $2M+ annual sales | 31.0% |
| Full-service, under $2M annual sales | 33.7% |
The range across most restaurants is 28–35% of food sales. Alcohol and beverage cost runs lower — typically 20–25% of beverage sales for spirits and beer, and 30–35% for wine.
If your food cost is running above 35%, the culprit is usually one of three things: portion inconsistency, purchase price increases not yet reflected in menu prices, or waste and theft. Run your ingredient costs through the restaurant food cost calculator to identify which items are driving the overage.
Labor
Labor is the category where most restaurant budgets go wrong — not because operators don't know it's expensive, but because they underestimate how many line items belong here.
According to the NRA 2025 data:
| Category | Median Labor Cost % |
|---|---|
| Full-service restaurants (all operators) | 36.5% |
| Full-service, profitable operators only | 34.2% |
| Full-service, loss-reporting operators | 42.9% |
| Limited-service restaurants | 31.7% |
Labor has increased significantly above historical norms. Full-service restaurants averaged around 33% a decade ago; the 2024 median of 36.5% reflects minimum wage increases and wage inflation across most markets.
Your labor budget should include:
- Hourly wages — FOH (servers, hosts, bussers, bartenders) and BOH (line cooks, prep, dishwashers)
- Management salaries — typically around 10% of revenue on its own for well-run operations
- Payroll taxes — Social Security, Medicare, FUTA, SUTA (adds roughly 10–12% to wage cost)
- Workers' compensation insurance — rates vary by state and classification
- Employee benefits — health insurance, paid leave, any employer retirement contributions
Most restaurants track a single "labor cost %" that includes all of the above. Budget it at that fully loaded rate, not just base wages. For a deeper look at tip credits, FICA credits, and overtime calculations that affect your total labor line, see the restaurant payroll tips guide.
Prime Cost
Prime cost — food and beverage cost combined with total labor cost — is the most important number in a restaurant budget. It determines whether everything else (rent, utilities, insurance, profit) is possible.
The widely cited target:
- Quick-service and fast-casual: 55–60% of sales
- Full-service: 60–65% of sales
If prime cost is consistently above 65%, there's not enough revenue left to cover occupancy, overhead, and generate any profit. At the NRA's 2024 median of 32.0% food cost + 36.5% labor, a typical full-service restaurant is running prime cost around 68–69%. That math explains the 2.8% median pre-tax profit margin reported for full-service restaurants in the same dataset.
Occupancy
Occupancy includes rent, property taxes, and any common area maintenance (CAM) fees. The NRA 2025 data puts the median at:
- Full-service restaurants: 5.7% of sales
- Limited-service restaurants: 5.2% of sales
- Urban/city center locations: 6.0% of sales
Occupancy is largely fixed once you sign the lease, which is why site selection and rent negotiation matter so much upfront. A location at 8–10% of projected sales will be very difficult to make profitable, even with tight food and labor costs.
Utilities
Restaurants are energy-intensive. Utilities typically run 3–5% of revenue and include:
- Electricity (commercial rates, heavy use from refrigeration, cooking equipment, HVAC)
- Natural gas (cooking and heating)
- Water and sewer
- Garbage and recycling
These costs aren't entirely fixed — energy usage tracks somewhat with volume — but they don't flex proportionally with sales. Budget them as a monthly dollar amount based on historical bills, then track the % of sales as a secondary metric.
Other Operating Expenses
| Category | Typical Range |
|---|---|
| Marketing and advertising | 3–6% of sales |
| Insurance (property, liability, liquor) | 1–2% of sales |
| Credit card processing fees | 2.2–4.5% of sales |
| Repairs and maintenance | 1–3% of sales |
| Cleaning supplies and smallwares | 0.5–1% of sales |
| Technology (POS, scheduling, reservations) | 0.5–1% of sales |
| Accounting, legal, G&A | 0.5–1% of sales |
| Licenses, permits, training | Variable |
Credit card processing fees are one of the most underbudgeted line items. At 2.5–3.5% on most card types, a restaurant doing $1M in annual card sales is paying $25,000–$35,000 in processing fees — more than many operators realize.
Contingency
Include a contingency line of 2–5% of projected total expenses. This isn't a slush fund — it's a reserve for costs you can't anticipate at budget time: an equipment failure, a spike in ingredient costs, unexpected repairs. Restaurants operate on margins too thin to absorb unplanned expenses without one.
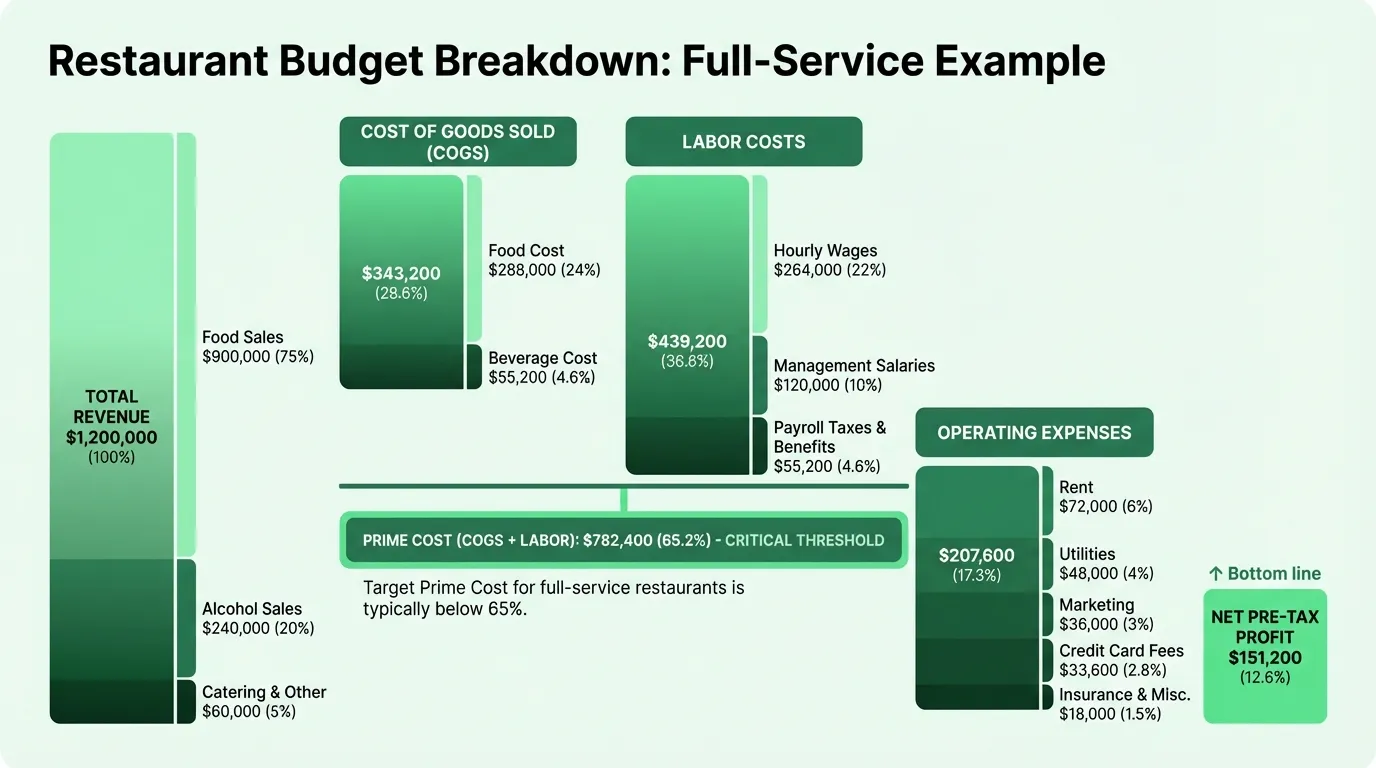
Example: A Full-Service Restaurant Annual Budget
Here's a realistic example for a full-service restaurant doing $1.2M in annual revenue:
Revenue
| Category | Amount | % of Revenue |
|---|---|---|
| Food sales | $900,000 | 75% |
| Alcohol and beverage sales | $240,000 | 20% |
| Catering and private events | $60,000 | 5% |
| Total Revenue | $1,200,000 |
Expenses
| Category | Amount | % of Revenue |
|---|---|---|
| Food cost (32% of food sales) | $288,000 | 24.0% |
| Beverage cost (23% of beverage sales) | $55,200 | 4.6% |
| Total COGS | $343,200 | 28.6% |
| Hourly wages (FOH + BOH) | $264,000 | 22.0% |
| Management salaries | $120,000 | 10.0% |
| Payroll taxes and benefits | $55,200 | 4.6% |
| Total Labor | $439,200 | 36.6% |
| Prime Cost | $782,400 | 65.2% |
| Rent | $72,000 | 6.0% |
| Utilities | $48,000 | 4.0% |
| Marketing | $36,000 | 3.0% |
| Insurance | $18,000 | 1.5% |
| Credit card processing | $33,600 | 2.8% |
| Repairs and maintenance | $18,000 | 1.5% |
| Technology and software | $9,600 | 0.8% |
| Supplies and smallwares | $9,600 | 0.8% |
| G&A (accounting, legal, permits) | $9,600 | 0.8% |
| Contingency | $12,000 | 1.0% |
| Total Operating Expenses | $266,400 | 22.2% |
| Net Pre-Tax Profit | $151,200 | 12.6% |
This example runs slightly above the NRA 2024 median profit margin — which reflects the 65% prime cost target being hit rather than exceeded. Real operations often run closer to 2–4% net margin because of higher labor costs and lower-than-budgeted revenue.
Need a ready-made budget template for your restaurant?
Download a pre-built spreadsheet with industry-specific categories, formulas, and formatting.
The Budget-to-Actual Review
A budget only produces value when you compare it to actual results. The process is straightforward:
- Pull your monthly P&L from your POS or accounting system
- Place actual results next to budgeted amounts, line by line
- Calculate the variance (dollars and percentage)
- Investigate any line item that's more than 5–10% off budget
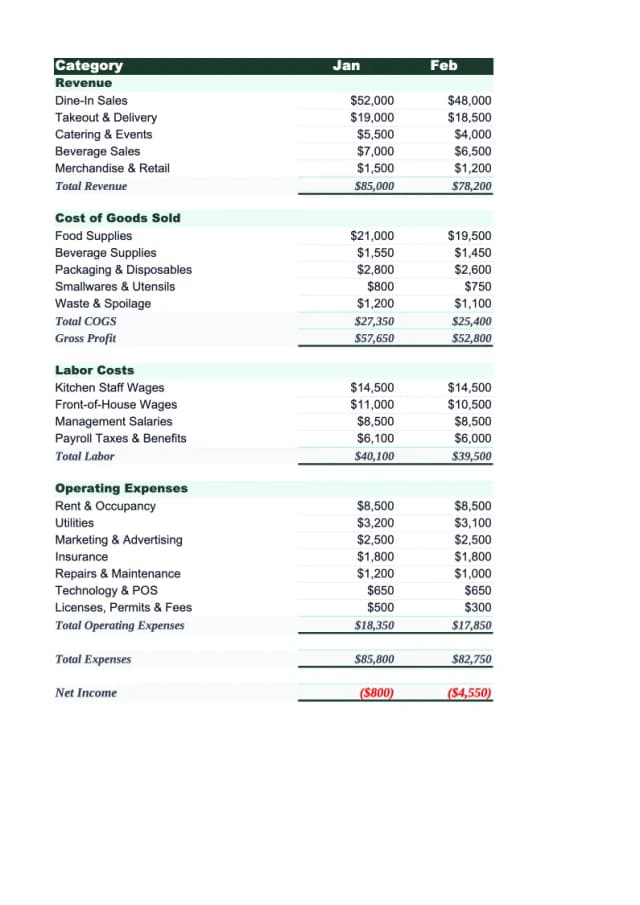
The most actionable comparisons are food cost % and labor cost %. If food cost comes in at 36% when you budgeted 32%, that's a $3,600 variance on a $90,000 revenue month — enough to eliminate most of the month's profit. Finding that by month-end gives you six weeks to investigate before it happens again.
Common causes of food cost variance: a supplier price increase not yet reflected in menu pricing, a new item with higher waste, or a portion control issue in the kitchen. The restaurant pricing guide covers how to recalculate menu prices when ingredient costs shift.
Common causes of labor cost variance: more overtime than scheduled, higher-than-planned hours in a slow week, or a new hire not yet at full productivity.
What the Budget Can't Tell You
A budget is a target, not a guarantee. It tells you where you want to land — it doesn't tell you whether you'll make it through the month with cash in the bank.
That's what a cash flow projection does. A restaurant can be on track against budget while still running out of cash — if vendor payments cluster in the same week, payroll hits before credit card settlements post, or a catering deposit hasn't arrived yet. The restaurant cash flow example shows exactly how this timing gap plays out week by week.
Use the budget for annual planning and monthly performance measurement. Use a cash flow projection for weekly cash management. The Restaurant Cash Flow Template handles the weekly view; the Restaurant Budget Template covers the annual and monthly budget-to-actual tracking.
Common Restaurant Budgeting Mistakes
Building revenue projections from optimism instead of data. A 20% revenue increase is a goal, not a budget assumption. Use last year's actuals as your baseline; then build a separate "growth" scenario if you want to model the upside.
Skipping the monthly distribution. An annual budget that doesn't account for seasonality produces a January that looks like a disaster (because you're comparing against one-twelfth of an optimistic annual target) and a December that looks inexplicably easy. Build month-by-month.
Forgetting credit card processing fees. At 2.5–3.5% of sales, this is a meaningful line item that often gets lumped into "miscellaneous" or left out entirely.
Not involving managers. A budget created by ownership without input from the kitchen and floor managers produces targets that nobody responsible for hitting them believes in. Build it collaboratively.
Never looking at it again. The most common mistake. Build the comparison into your monthly routine — the budget is the measuring stick, not a filing task.
The Restaurant Budget Template is pre-built with all the categories above, monthly distribution rows, and a budget-vs-actual variance column — so the comparison happens automatically once you enter your monthly P&L data.
Last updated: March 23, 2026
Frequently Asked Questions
Related Articles
Coffee Shop Budget Example: Real Numbers and Benchmarks
A practical coffee shop budget example with real cost benchmarks — covering beverage COGS, labor, rent, equipment maintenance, and the line items most operators underestimate.
Church Budget Example: Categories, Percentages, and What to Include
A practical church budget example with real percentages for staff, facilities, missions, and programs — plus the line items most churches overlook.
Construction Budget Example: Line Items, Percentages, and What to Include
A practical construction budget example covering hard costs, soft costs, overhead allocation, and the line items most contractors underestimate.
Daycare Budget Example: Categories, Benchmarks, and What to Watch
A practical daycare budget example covering revenue sources, expense ratios, occupancy thresholds, and the line items that determine whether a center stays financially viable.
Event Planning Budget Example: Real Numbers for Your Business
A practical event planning budget example covering agency overhead, per-event costs, revenue models, and the benchmarks every planner needs to protect margins.
Hotel Budget Example: Departments, Benchmarks, and Real Numbers
A practical hotel budget example covering the USALI department structure, labor benchmarks, GOP targets, and the line items independent hoteliers most often miss.