Restaurant Sales Forecast: A Practical Example and Guide
How to build a restaurant sales forecast — covering the core formula, day-part analysis, seasonality adjustments, and how the forecast connects to every other financial decision.
Every major financial decision in a restaurant — how much food to order, how many staff to schedule, whether to take on debt — traces back to one number: how much are we going to sell?
The sales forecast is where that number comes from. It isn't a wish or a round figure from last year plus ten percent. It's a structured estimate built from guest counts, average check sizes, day-part patterns, and seasonal adjustments. Get it right and everything downstream works better. Ignore it and you're managing by feel.
What a Restaurant Sales Forecast Actually Is
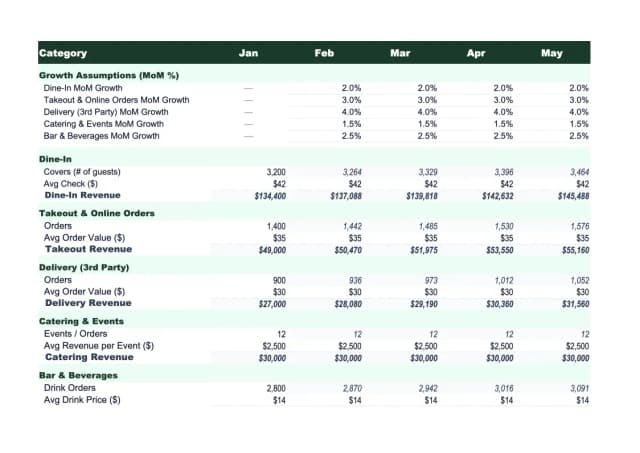
A restaurant sales forecast projects future revenue by breaking sales into its components. At the top level, you're estimating how many guests you'll serve and how much each will spend. Beneath that are the patterns — which days are stronger, which meal periods drive revenue, which channels (dine-in, takeout, delivery) carry different check averages.
A well-structured forecast includes:
- Guest count (covers) — the number of paying guests per day or meal period
- Average check size — what each guest spends on food and beverage
- Day-part breakdown — separate projections for lunch, dinner, and any other meal periods
- Channel split — dine-in, takeout, third-party delivery, and catering tracked separately
- Seasonality adjustment — multipliers based on historical patterns by month or week
- Actuals tracking — a column for what actually happened, so you can measure and refine
The forecast isn't a single number you calculate once. It's a living document you update weekly and reconcile against actual sales every month.
The Core Forecasting Formula
Two formulas cover most restaurant types:
For any restaurant:
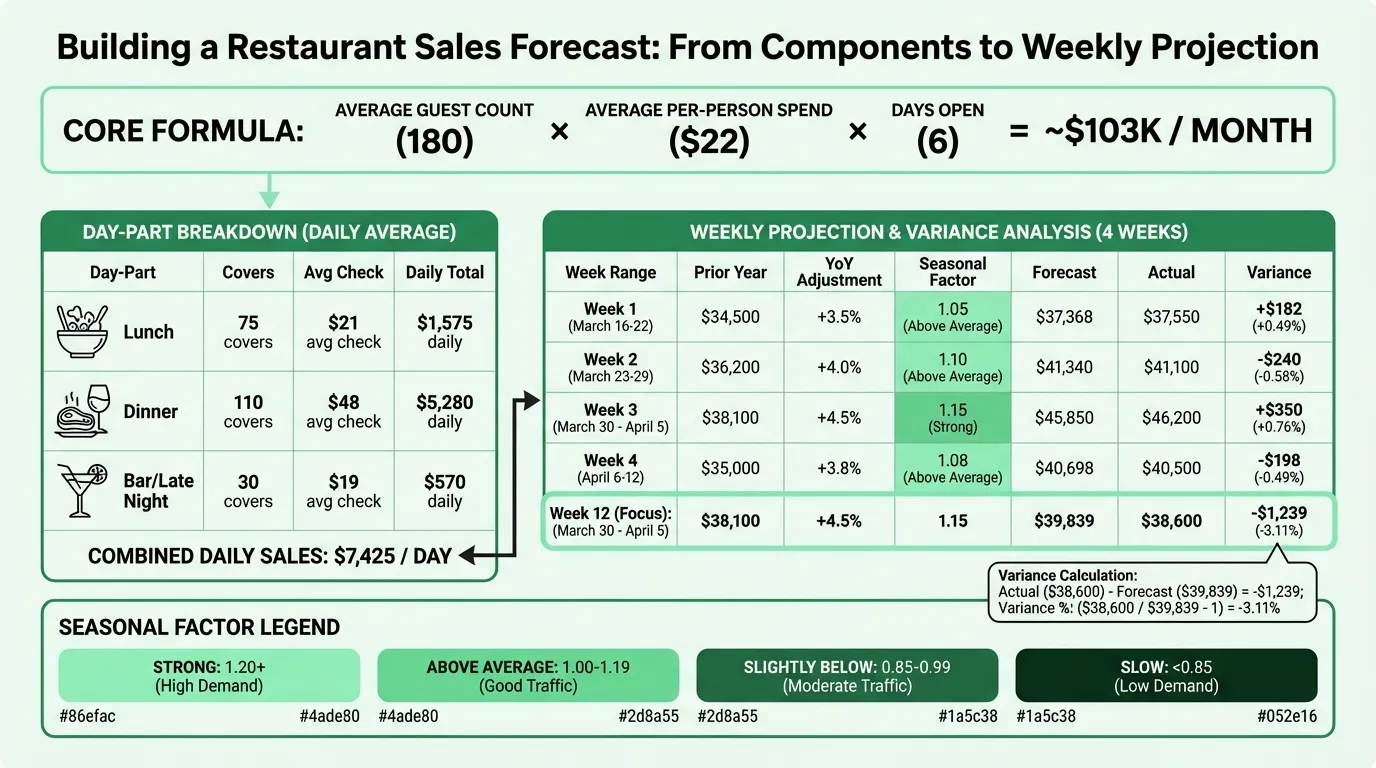
Projected Sales = Average Guest Count × Average Per-Person Spend × Days Open
If you serve 180 guests per day, average $22 per guest, and are open six days per week:
180 × $22 × 6 = $23,760/week → ~$103,000/month
For table-service restaurants:
Projected Sales = Table Count × Seat Allotment × Average Ticket × Table Turn Rate
A 50-seat restaurant with an average ticket of $45 and 1.8 turns per dinner service:
50 seats × $45 × 1.8 = $4,050 per dinner service
Run that across your open nights and add lunch to get a weekly projection.
These formulas are the floor. The sophistication comes from how accurately you populate each variable — and how well you segment by day-part, channel, and season.
Breaking It Down by Day-Part and Channel
Aggregated daily sales are useful for spotting overall trends. They're not useful for running a restaurant.
Lunch and dinner have fundamentally different check averages, staffing requirements, and guest counts. At a full-service restaurant, a $18 lunch check and a $48 dinner check are averaged into a misleading $33 — which doesn't reflect the economics of either meal period.
A good forecast segments by meal period:
| Day-Part | Avg. Covers | Avg. Check | Daily Revenue |
|---|---|---|---|
| Lunch | 75 | $21 | $1,575 |
| Dinner | 110 | $48 | $5,280 |
| Bar / Late Night | 30 | $19 | $570 |
| Total | 215 | — | $7,425 |
The same segmentation applies to revenue channels. Dine-in, takeout, and third-party delivery have different average checks, different cost structures, and different margin profiles. A restaurant generating 40% of revenue through third-party delivery has a materially different profit picture than one doing the same volume through dine-in — delivery platforms take 15–30% of the order value.
Track channel revenue separately in your forecast from day one. Aggregating it hides where your margin is actually going. The restaurant income statement example shows how revenue segmentation flows through to a monthly P&L that's actually useful for management.
How to Adjust for Seasonality
Most restaurants don't have a cash flow problem — they have a seasonality problem they didn't plan for.
The National Restaurant Association estimates the industry crossed $1.1 trillion in total sales in 2024, but that volume is not evenly distributed across months. Full-service restaurants typically see peaks in May–June (patio season) and November–December (holiday dining), with measurable troughs in January–February.
The practical method for adjusting forecasts for seasonality:
- Pull two to three years of monthly sales from your POS
- Calculate each month's revenue as a percentage of your annual average (or monthly average)
- Apply those percentages to your current year's forward projection
If January historically runs at 72% of your average month, your January forecast should use 72% of average projected revenue — not the average itself. This one adjustment eliminates most seasonal cash surprises.
For a restaurant with limited history, industry benchmarks by restaurant type are a reasonable starting point. Refine with your own data as it accumulates.
| Month Adjustment Factor | What It Means |
|---|---|
| 1.20+ | Strong month — consider extended hours, events |
| 1.00–1.19 | Above average |
| 0.85–0.99 | Slightly below average |
| Below 0.85 | Slow month — review staffing, reduce ordering thresholds |
Need a ready-made sales forecast template for your restaurant?
Download a pre-built spreadsheet with industry-specific categories, formulas, and formatting.
Forecasting Sales for a New Restaurant
No history means no baseline. But you're not forecasting blind — you're building from capacity constraints and market context.
The capacity analysis approach:
- Count seats and set service hours — a 60-seat restaurant open for lunch and dinner has a theoretical maximum of 120 covers per day at one turn, or 180 at 1.5 turns
- Apply realistic occupancy rates — months one to three typically run at 30–50% of capacity; a stabilized restaurant in a good market might run at 60–75%
- Estimate average check — research comparable restaurants in your area; your menu price points make this estimable before you open
- Build monthly projections — ramp from conservative occupancy in early months toward stabilized rates by month six to nine
The result is a 12-month ramp model that shows investors, lenders, and yourself what the business needs to look like to cover costs at various revenue levels.
Where the ramp model trips operators up: optimistic occupancy assumptions. Many pro formas project 70–80% occupancy by month three. In practice, a restaurant that hits that level in six months is doing well. Build a base case at conservative occupancy and a stretch case at your target — don't present the stretch case as the base.
The Restaurant Sales Forecast Template includes a new-restaurant ramp model alongside the historical-trend forecasting approach, so you can use whichever fits your situation.
What the Forecast Drives Downstream
The sales forecast is not a standalone document. It's the first domino that everything else depends on:
Labor scheduling. Guest count projections by day-part determine how many front-of-house and back-of-house staff you need per shift. Labor cost is typically targeted at 28–35% of forecasted revenue. Without a forecast, you're scheduling by feel — which almost always means overstaffing slow nights and scrambling on busy ones.
Food purchasing and COGS. Projected sales by menu mix drive weekly ordering quantities. Your target food cost percentage (typically 28–35% of revenue) becomes meaningful only when applied to a revenue number you trust. The restaurant food cost calculator helps translate forecast revenue into target purchasing budgets by ingredient category. Forecasting also tells you when volume will spike — so you're placing larger orders before a holiday weekend, not after.
Operating budget. The 12-month sales forecast becomes the revenue line of your annual operating budget. Fixed and variable cost targets — rent as a percentage of revenue, marketing spend, utility costs — are all calibrated against projected revenue. The restaurant budget example shows how forecast revenue feeds into a full annual budget with monthly distribution and variance tracking. A budget built without a sales forecast is guesswork dressed up in a spreadsheet.
Cash flow projection. Sales forecasts inform when cash arrives. The Restaurant Cash Flow Template maps projected inflows against the timing of outflows (vendor invoices, payroll, rent) to show whether your bank balance will cover obligations week by week. Even a profitable month can produce a cash shortage if timing is off.
Variance analysis. Each month, you compare actual sales against your forecast. Consistent shortfalls in a specific day-part or channel tell you something operational is wrong — maybe dinner is underperforming because of a new competitor, or delivery is growing faster than the forecast assumed. That signal is only visible if you had a forecast to compare against.
A Working Example
Here's what a simplified weekly restaurant sales forecast looks like for a full-service restaurant mid-season:
| Week | Prior Year | YoY Adj. | Seasonal Factor | Forecast | Actual | Variance |
|---|---|---|---|---|---|---|
| Week 12 (March 16) | $41,200 | +4% | 0.93 | $39,839 | $38,600 | -$1,239 |
| Week 13 (March 23) | $43,500 | +4% | 0.95 | $43,134 | — | — |
| Week 14 (March 30) | $44,800 | +4% | 0.97 | $45,288 | — | — |
| Week 15 (April 6) | $46,100 | +4% | 1.02 | $48,815 | — | — |
The YoY adjustment captures the trend in your business. The seasonal factor adjusts for where you are in the calendar year. Together they produce a forecast that reflects both your performance trajectory and historical patterns.
That Week 12 variance of -$1,239 (-3.1%) is worth noting but not alarming in isolation. If Week 13 also comes in short, the pattern is worth investigating — a new competitor, a weather event, or a slip in service quality. Without the forecast, you'd just see a slower March.
Building and Maintaining the Forecast
A restaurant sales forecast is only useful if you maintain it. The basic rhythm:
- Weekly: Enter prior week actuals, check whether the next four weeks show any concerning trends, adjust ordering and scheduling if the forecast has shifted
- Monthly: Reconcile the month's actuals against forecast, update the seasonal factors if needed, revise the forward 12-week projection
- Annually: Rebuild the full-year forecast using actual prior year data as the new baseline
The operators who benefit most from forecasting aren't the ones with the most sophisticated models. They're the ones who look at the numbers every week and act on what they see.
If you're starting from scratch, the Restaurant Sales Forecast Template includes the weekly and monthly views, day-part breakdown, seasonality adjustment, and YoY comparison — formatted for both operational use and lender reporting.
Last updated: March 25, 2026
Frequently Asked Questions
Related Articles
Auto Repair Pricing Guide: How to Price Your Shop Profitably
How auto repair shop owners should price labor and parts — covering labor rate calculation, flat-rate hours, parts markup matrices, diagnostic fees, and the metrics that matter.
Cleaning Service Pricing Guide: How to Price Your Business Profitably
A practical guide to cleaning service pricing — covering hourly vs. flat rate vs. per square foot models, price benchmarks by service type, labor cost math, and the common mistakes that keep cleaning businesses from hitting their margin targets.
Construction Pricing Guide: How to Price Your Work Profitably
How contractors should price construction work — covering labor burden, overhead recovery, material markup, pricing methods, and the mistakes that quietly erode margin.
Electrical Pricing Guide: How to Price Your Work Profitably
How electricians and electrical contractors should price their work — covering hourly rates, flat-rate pricing, overhead recovery, material markup, and common mistakes that erode margin.
Hotel Sales Forecast: A Practical Example and Guide
How to build a hotel sales forecast — covering rooms, F&B, events revenue, key metrics like RevPAR and ADR, booking pace, and the rolling forecast structure that keeps you ahead.
Landscaping Pricing Guide: How to Price Your Work Profitably
A practical guide to landscaping pricing — covering hourly rates, per-square-foot benchmarks, overhead recovery, and the markup math that determines whether you're making money.