Restaurant Sales Forecast Template
Project your restaurant's revenue by covers, average check, and sales channel — with monthly breakdowns, seasonal adjustments, and actual vs forecast tracking built in.
What's Inside This Restaurant Sales Forecast Template
This template includes 6 worksheets, each designed for a specific part of your restaurant financial workflow:
Assumptions
The starting point for your entire forecast.
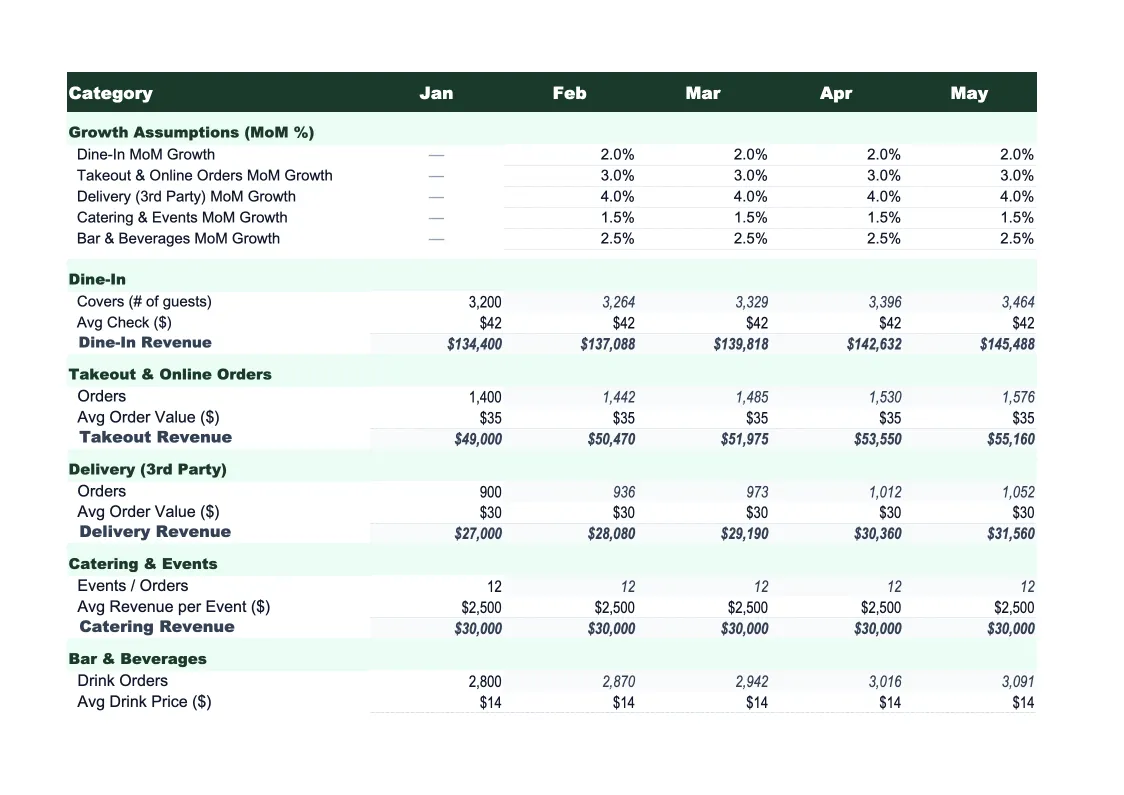
Monthly Forecast
The core projection sheet, showing 12 months of projected revenue by channel — dine-in broken down by day part, takeout, delivery platform commissions, catering, and beverage/alcohol.
Annual Summary
A full-year rollup showing total projected revenue by channel for the entire forecast period, month by month and in aggregate.
Actual vs Forecast
Enter your actual monthly revenue figures alongside your projections and the sheet calculates the dollar variance and percentage variance for every channel.
Scenario Comparison
Three side-by-side forecast scenarios — base case, upside, and downside — built from different assumption sets.
Dashboard
A visual summary of your forecast with pre-built charts: monthly revenue by channel (stacked bar), actual vs forecast trend line, revenue mix by channel (pie), and average check trend over the forecast period.
Restaurant Sales Forecast Template Features
- Driver-based model: covers × check × days open per month
- Revenue split by day part (breakfast, lunch, dinner) and channel
- Seasonal adjustment factors for each month
- Three-scenario comparison (base, upside, downside)
- Actual vs forecast tracker with rolling accuracy score
- Visual dashboard with channel mix and trend charts
How to Use This Restaurant Sales Forecast Spreadsheet
Start with the Assumptions sheet — it drives everything else. Fill in your seating capacity, days open per week, and average covers by meal period. Then enter your average check size for each day part (breakfast checks are typically lower than dinner), and set your expected channel mix: what percentage of revenue comes from takeout, delivery, catering, and alcohol. If you have historical POS data, use last year's actuals as your baseline — most restaurants find the initial setup takes 20–30 minutes and requires a few passes to get the numbers to feel right.
Once your assumptions are set, review the Monthly Forecast sheet to check whether the projections look realistic month by month. Apply seasonal adjustment factors for months where you know volume shifts — summer patio season, holiday weeks in December, the January slowdown. The Scenario Comparison sheet is worth filling out early too: set a conservative downside (maybe 15% fewer covers than base) and an optimistic upside, then check whether the range feels plausible based on your experience. This takes another 20 minutes but gives you a much more defensible forecast.
15 minutes from download to your first revenue forecast
Download the template, plug in your covers and average check, and see your restaurant's projected revenue — month by month, channel by channel.
Why Every Restaurant Needs a Sales Forecast Template
Restaurant revenue is more predictable than most operators believe — but only once you break it down into its components. Total revenue is covers × average check × days open, repeated across each day part and channel. The problem with gut-feel forecasting is that it treats revenue as one number, so it's impossible to pinpoint what drove a good week or a bad one. A driver-based forecast makes the assumptions explicit: if your Wednesday lunch covers are 40 and your average lunch check is $18, you know exactly what you're projecting, and when actuals differ, you know exactly where to look.
For restaurants, the highest-leverage forecast variables are covers by day part and channel revenue mix. Covers are driven by seating capacity, table turnover rate, and occupancy percentage — and these vary dramatically by day of week and season. A well-built restaurant forecast reflects that Wednesday lunch runs at 60% occupancy while Friday dinner pushes 95%. Channel mix has become a major variable post-2020: delivery platforms take 20–30% commission on a lower average check, so a shift from 20% to 35% delivery mix meaningfully changes your effective revenue per cover even if total order count stays flat.
Restaurant Industry at a Glance
Financial templates built for restaurants — from fast-casual to fine dining. Pre-loaded with food cost categories, labor splits, and industry-standard KPIs.
Revenue Drivers
- Dine-in sales
- Takeout & delivery
- Catering
- Alcohol sales
Key Cost Categories
- Food costs (COGS)
- Labor
- Rent & occupancy
- Utilities
- Marketing
- Equipment & maintenance
Typical Margins
Gross: 60-70% · Net: 3-9%
Seasonality
Higher revenue in summer and holiday seasons; January-February typically slowest months.
Key Performance Indicators
Restaurant Sales Forecast Template FAQ
More Restaurant Templates
Restaurant Balance Sheet Template for Excel
$29
Restaurant Budget Template for Excel
$29
Restaurant Business Plan Template for Excel
$39
Restaurant Cash Flow Template for Excel
$29
Restaurant Expense Tracker Template for Excel
$29
Restaurant Financial Model Template for Excel
$29
Restaurant Income Statement Template for Excel
$29
Restaurant Invoice Template for Excel
$29
Restaurant KPI Dashboard Template for Excel
$29
Restaurant P&L Template for Excel
$29
Restaurant Pro Forma Template for Excel
$29
Restaurant Project Budget Template for Excel
$29
Restaurant Valuation Template for Excel
$29
More Sales Forecast Templates
Restaurant Sales Forecast Template
$29