Restaurant Income Statement Example: What It Shows and How to Use It
A practical restaurant income statement example with real line items, NRA benchmarks, and a worked example showing what 2-4% net margins actually look like.
Most restaurants don't fail because they lack customers. They fail because the numbers on their income statement are quietly wrong for months before anyone notices.
The restaurant income statement — also called a P&L — is the document that makes those numbers visible. Understanding how to read one, and what the benchmarks should look like at each line, is the difference between running a restaurant and managing one.
Income Statement vs. P&L: Same Document
Before anything else: income statement and P&L statement mean the same thing. "Income statement" is the formal accounting term used under GAAP. "P&L" is what most restaurant operators call it day-to-day. Both documents show revenue, subtract all costs in order, and arrive at net profit or loss.
Some operators assume these are different reports. They aren't. If your accountant sends you an "income statement" and your POS generates a "P&L report," you're looking at two versions of the same underlying document — typically with different levels of detail or formatting.
The Structure of a Restaurant Income Statement
A restaurant income statement follows a logical sequence: start with what came in, subtract what went out, arrive at what's left.
1. Revenue
Revenue should be broken out by type, not lumped into a single total:
- Food sales — the core of most restaurant revenue
- Alcohol and beverage sales — tracked separately because cost percentages differ significantly from food
- Catering and private events — often different margin profiles
- Delivery revenue — record net (after platform fees deducted) or gross with fees as a separate expense line
Breaking out revenue by type matters because food and beverage have different cost structures. If you're comparing food cost as a percentage of total revenue instead of food revenue only, you'll be comparing the wrong denominator.
2. Cost of Goods Sold (COGS)
COGS is calculated as: Beginning Inventory + Purchases − Ending Inventory
It represents the direct cost of the food and beverages sold. Food cost is tracked as a percentage of food sales; beverage cost as a percentage of beverage sales.
According to the National Restaurant Association's 2025 Operations Data Abstract — based on data from over 900 operators covering fiscal year 2024:
| Concept Type | Median Food Cost % |
|---|---|
| Full-service restaurants | 32.0% |
| Limited-service restaurants | 32.4% |
| Full-service, $2M+ annual sales | 31.0% |
| Full-service, under $2M annual sales | 33.7% |
Beverage cost runs lower: typically 20–25% of spirits and beer sales, 30–35% of wine sales. If your beverage cost is running above 40%, overpouring, spillage, or theft is likely the culprit. Strong restaurant inventory management — particularly daily bar counts and weekly full counts — is typically what separates operators who catch these issues early from those who discover them at month-end.
3. Gross Profit
Gross profit = Revenue − COGS. For most full-service restaurants, this lands around 68–72% of revenue. It represents what's available to cover labor, occupancy, and overhead — and generate a profit.
A healthy gross profit gets erased fast if labor and occupancy are high. That's why gross profit alone doesn't tell you whether a restaurant is performing well.
4. Labor
Labor is the largest controllable expense on the income statement and the category where most restaurants diverge from budget.
From the NRA 2025 data:
| Category | Median Labor Cost % |
|---|---|
| Full-service restaurants (all) | 36.5% |
| Full-service, profitable operators | 34.2% |
| Full-service, loss-reporting operators | 42.9% |
| Limited-service restaurants | 31.7% |
The gap between profitable and loss-reporting operators — 34.2% vs. 42.9% — is almost entirely explained by labor. A difference of 8.7 percentage points on a $1.2M restaurant is over $100,000 per year.
Your labor line should include everything:
- Hourly wages (FOH and BOH)
- Management salaries
- Payroll taxes (Social Security, Medicare, FUTA, SUTA — roughly 10–12% on top of wages)
- Workers' compensation insurance
- Employee benefits (health insurance, paid leave)
Many operators track base wages and don't include payroll taxes in their "labor %" calculation. This understates actual labor cost by 10–12%. Use the fully loaded figure. The restaurant payroll tips guide covers the specific line items — including FICA tip credits and overtime rules — that affect your total labor number.
5. Prime Cost
Prime cost is COGS plus total labor. It's the most closely watched number in restaurant finance.
Target: 60–65% of revenue for full-service; 55–60% for limited-service.
At the 2024 NRA median of 32.0% food cost + 36.5% labor, a typical full-service restaurant is running prime cost around 68–69%. That math explains the 2.8% median pre-tax profit margin for the same group. There isn't much left after prime cost, occupancy, and overhead.
6. Occupancy
Occupancy includes rent, CAM (common area maintenance) fees, and property taxes. It should run:
- Full-service restaurants: 5–7% of revenue
- Limited-service restaurants: 5–6% of revenue
- Urban/high-rent locations: can reach 8–10%
A location at 10–12% of projected sales is very difficult to make profitable even with tight food and labor costs. Occupancy is largely fixed once you sign a lease — which is why this calculation matters most during site selection.
7. Other Operating Expenses
| Category | Typical Range (% of sales) |
|---|---|
| Utilities (electricity, gas, water) | 3–5% |
| Marketing and advertising | 2–5% |
| Credit card processing fees | 2–4% |
| Insurance (liability, property, liquor) | 1–2% |
| Repairs and maintenance | 1–3% |
| Technology (POS, reservations, scheduling) | 0.5–1% |
| Supplies and smallwares | 0.5–1% |
| Accounting, legal, G&A | 0.5–1% |
Credit card processing fees are consistently underestimated. At 2.5–3.5% on most card types, a restaurant doing $1M in annual card sales is paying $25,000–$35,000 in processing fees — an amount that rivals many marketing budgets.
8. Net Profit (or Loss)
Net pre-tax profit is what remains after all expenses. Industry-wide, this is thin:
- Full-service restaurants (all operators): 2.8% median pre-tax margin (NRA 2025)
- Full-service, $2M+ revenue: 4.3% median
- Full-service, under $2M revenue: 1.1% median
- Limited-service restaurants: 4.0% median
- Industry-wide average: typically cited at 3–5% (Toast POS data)
A 3–5% net margin on $1M in revenue is $30,000–$50,000. Thin margins mean that small improvements in food cost or labor have outsized impact on the bottom line. The restaurant profit margin calculator quantifies exactly how a 1-2 point shift in food cost or labor changes your net margin.
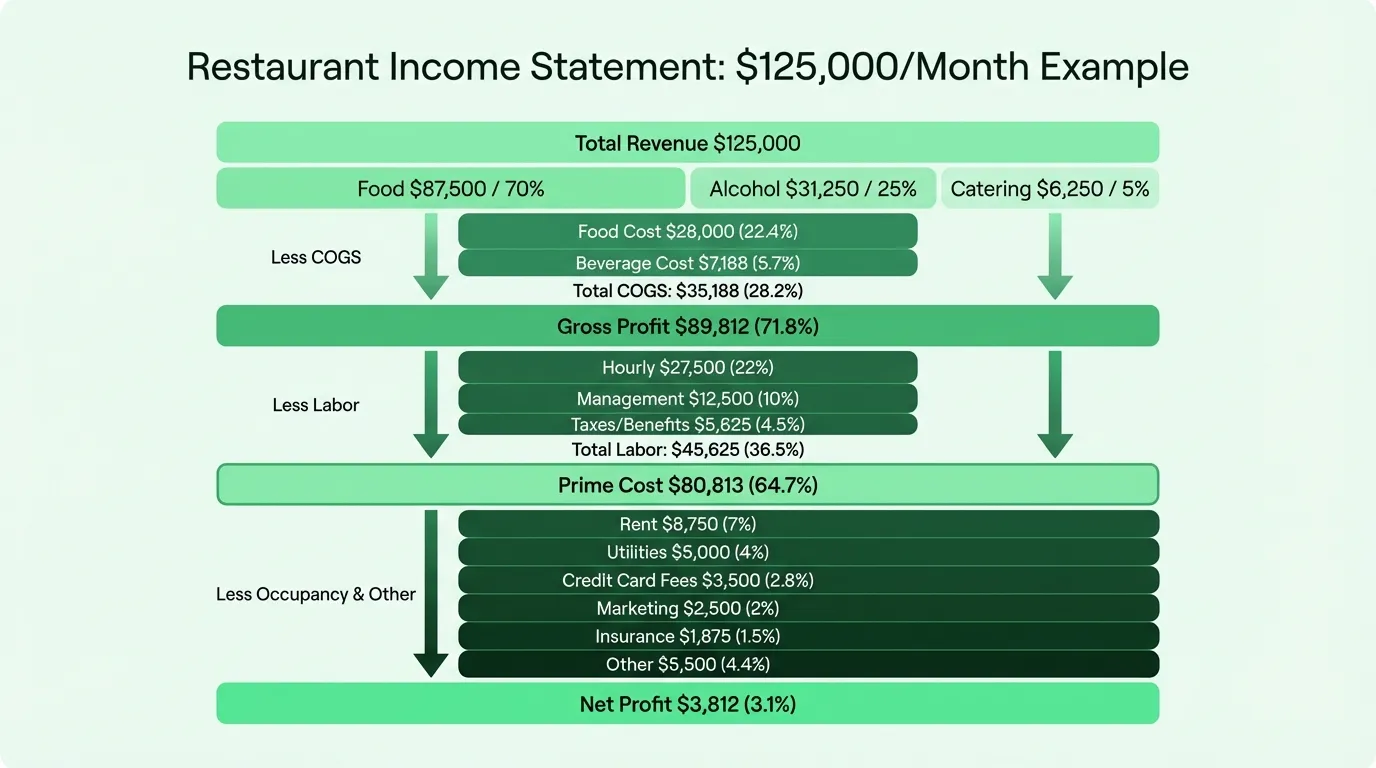
Worked Example: Full-Service Restaurant at $125,000/Month
Here's a realistic monthly income statement for a full-service restaurant doing $125,000 in monthly revenue:
Revenue
| Category | Amount | % of Revenue |
|---|---|---|
| Food sales | $87,500 | 70% |
| Alcohol and beverage sales | $31,250 | 25% |
| Catering | $6,250 | 5% |
| Total Revenue | $125,000 | 100% |
Cost of Goods Sold
| Category | Amount | % of Revenue |
|---|---|---|
| Food cost (32% of food sales) | $28,000 | 22.4% |
| Beverage cost (23% of beverage sales) | $7,188 | 5.7% |
| Total COGS | $35,188 | 28.2% |
| Gross Profit | $89,812 | 71.8% |
Labor
| Category | Amount | % of Revenue |
|---|---|---|
| Hourly wages (FOH + BOH) | $27,500 | 22.0% |
| Management salaries | $12,500 | 10.0% |
| Payroll taxes and benefits | $5,625 | 4.5% |
| Total Labor | $45,625 | 36.5% |
Prime Cost: $80,813 (64.7%)
Occupancy
| Category | Amount | % of Revenue |
|---|---|---|
| Rent | $8,750 | 7.0% |
| Utilities | $5,000 | 4.0% |
| Total Occupancy | $13,750 | 11.0% |
Other Operating Expenses
| Category | Amount | % of Revenue |
|---|---|---|
| Credit card processing (2.8%) | $3,500 | 2.8% |
| Marketing | $2,500 | 2.0% |
| Insurance | $1,875 | 1.5% |
| Repairs and maintenance | $1,250 | 1.0% |
| Technology and software | $875 | 0.7% |
| Supplies | $750 | 0.6% |
| G&A (accounting, legal) | $875 | 0.7% |
| Total Operating | $11,625 | 9.3% |
Bottom Line
| Amount | % | |
|---|---|---|
| Total Expenses | $106,188 | 84.9% |
| Net Pre-Tax Profit | $3,812 | 3.1% |
This example lands at 3.1% net margin — consistent with the NRA's full-service median. Note that the location's rent (7.0% of sales) is slightly high; at 5.5%, net margin would improve by nearly two percentage points.
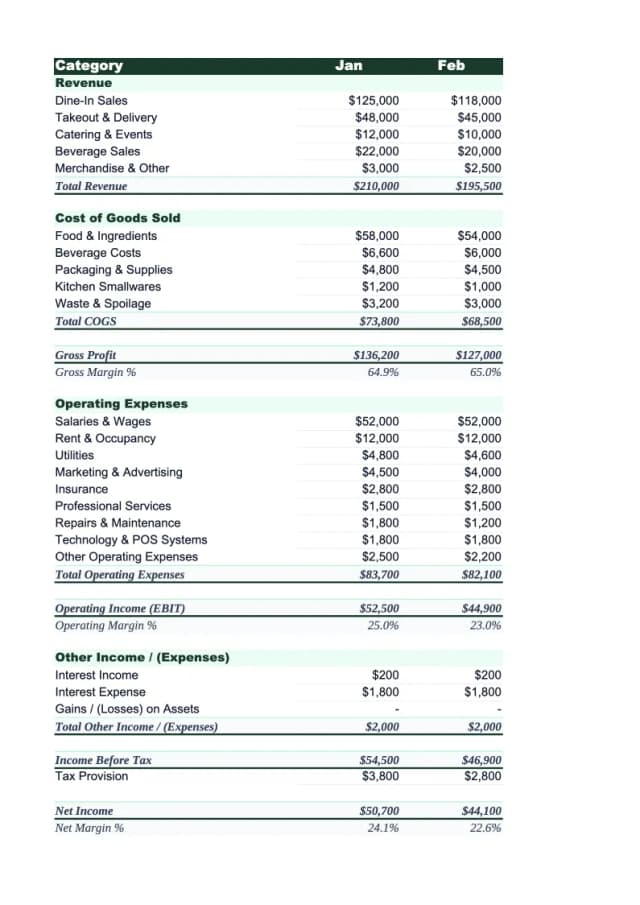
Need a ready-made income statement template for your restaurant?
Download a pre-built spreadsheet with industry-specific categories, formulas, and formatting.
How to Use the Income Statement Each Month
An income statement you produce once a year is a historical record. One you produce monthly becomes a management tool.
The monthly review process:
-
Calculate key percentages — food cost %, labor %, prime cost %. These ratios matter more than absolute dollar amounts because they're comparable across months with different sales volumes.
-
Compare against your budget — what did you expect each line to be? Where did actuals diverge?
-
Investigate variances over 5% — a food cost that runs 35% instead of 32% on $87,500 in food sales is a $2,625 overage. In one month. On one line. That's the kind of variance that erases profit if it persists.
-
Check prime cost first — if prime cost is in range (60–65%), you have a chance to be profitable. If it's above 68–69%, everything else becomes a struggle.
The Restaurant Income Statement Template is structured for this monthly comparison workflow — with budget columns, actual columns, and variance calculations built in.
What the Income Statement Doesn't Tell You
Two important limitations:
It doesn't show when cash moves. The income statement records revenue when it's earned and expenses when they're incurred — not when cash actually hits your account. A busy Saturday night shows as revenue even though the card settlements arrive Tuesday. This is why a profitable restaurant can run out of cash. For cash timing, you need a separate cash flow projection.
It doesn't explain why costs are where they are. A 36% food cost tells you there's a problem. It doesn't tell you whether the problem is supplier prices, portion sizes, waste, or theft. Solving the problem requires operational investigation — recipe costing, inventory reconciliation, and waste tracking.
The income statement surfaces the numbers. Fixing them requires the work behind the numbers.
Related Templates
If you're using the income statement for monthly management, two other documents complete the financial picture:
- Restaurant Budget Template — set targets before the month starts, then compare against actual income statement results in a budget-vs-actual format
- Restaurant Cash Flow Template — track when cash actually moves, separate from when revenue is recognized
The income statement answers: are we profitable? The cash flow projection answers: can we make payroll next week? Both questions matter. Neither answers the other.
Last updated: March 23, 2026
Frequently Asked Questions
Related Articles
Coffee Shop Income Statement Example: Revenue, Costs, and Margins
A coffee shop income statement example with beverage cost benchmarks, labor targets, prime cost rules, and a worked P&L for an independent café doing $480K/year.
Daycare Income Statement Example: Revenue, Costs, and Margins
A daycare income statement example with tuition revenue, CACFP reimbursements, staff cost benchmarks, and a worked P&L for a 50-child childcare center.
Food Truck Income Statement Example: Line Items and Benchmarks
A food truck income statement example with food cost benchmarks, unique line items like commissary and pitch fees, and a worked P&L for a single-truck operation.
Healthcare Income Statement Example: Revenue, Expenses, and Margins
A healthcare income statement example covering net patient revenue, contractual adjustments, expense benchmarks, and operating margin targets for providers.
Healthcare Pro Forma Example: What to Include and How to Build One
A practical healthcare pro forma example — covering revenue projections, payer mix, expense benchmarks, and a worked model for a new medical practice or service line.
Hotel Pro Forma Example: What to Include and How to Build One
A practical hotel pro forma example — covering RevPAR, GOP, undistributed expenses, FF&E reserves, and a worked model for acquisition or development underwriting.