Retail Pricing Guide: Markups, Margins, and What to Charge
A practical retail pricing guide covering markup formulas, gross margin benchmarks by category, pricing strategies, when to discount, and the most common mistakes small retailers make.
Most retail pricing failures trace back to one source: prices set by looking at competitors rather than by understanding what the work actually costs and what the market will support.
The result is a store that looks busy, runs adequate volume, and still can't explain why the bank balance is thin. The problem isn't sales — it's that the margin math was never right from the start.
This guide covers the mechanics: how to calculate retail prices, what gross margins look like across product categories, which pricing strategies work for which situations, and the mistakes that quietly erode profitability.
The Markup vs. Margin Problem
Before anything else, get this math right. Markup and gross margin are not the same number, and confusing them is one of the most common and costly mistakes in retail.
Markup is the amount added to cost, expressed as a percentage of cost. Gross margin is profit expressed as a percentage of the selling price.
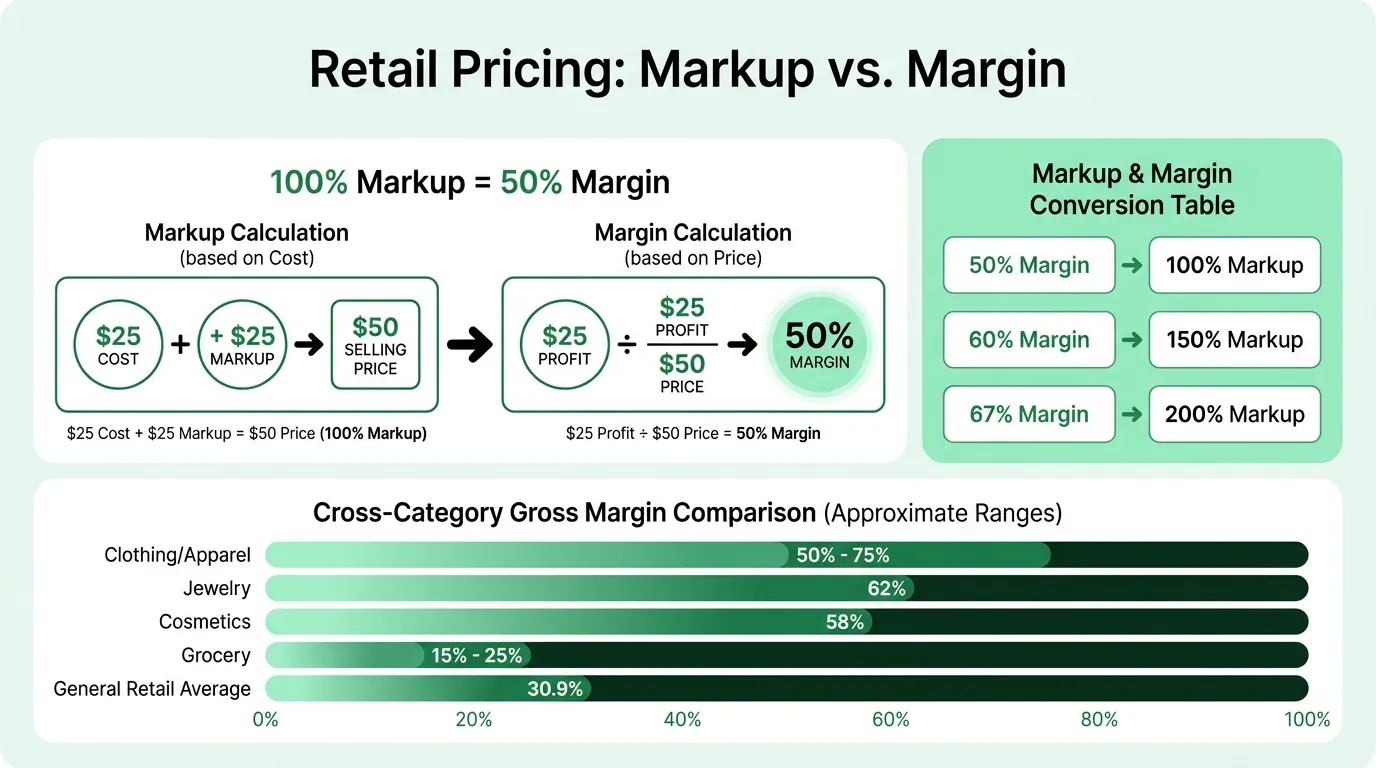
A product that costs $25 and sells for $50 has:
- A 100% markup (you added $25 to a $25 cost)
- A 50% gross margin ($25 profit ÷ $50 selling price)
The two numbers look completely different, but many retailers use them interchangeably. If your target is a 50% gross margin and you apply a 50% markup instead, you're running 33% gross margin — and working significantly harder for significantly less profit.
The formula to convert between them:
| Target Gross Margin | Required Markup on Cost |
|---|---|
| 25% | 33% |
| 33% | 50% |
| 40% | 67% |
| 50% | 100% |
| 60% | 150% |
| 67% | 200% |
Formula for retail price from a target gross margin:
Retail Price = Landed Cost ÷ (1 − Target Gross Margin)
Example: A product has a $20.25 landed cost (wholesale + inbound freight + duty). You want a 55% gross margin. $20.25 ÷ (1 − 0.55) = $20.25 ÷ 0.45 = $45.00 retail price
Always start with landed cost — wholesale price plus every cost to get the item to your shelves — not just the supplier invoice. Inbound freight, import duties, and credit card processing fees (typically 2.5–3.5%) all reduce your effective margin if they're not built into the price. Run your landed cost through our retail markup calculator to confirm the retail price hits your target margin.
Gross Margin Benchmarks by Category
Margins vary widely by product category. What's realistic for a clothing boutique is not what's realistic for a consumer electronics retailer. According to NYU Stern School of Business data from January 2024, here's how retail gross margins typically distribute by category:
| Category | Typical Gross Margin | Notes |
|---|---|---|
| Clothing / Apparel | 50%–75% | Mid-market ~50–55%; boutique/luxury higher |
| Jewelry | ~62% | Average for jewelry retail (NYU Stern, Jan 2024) |
| Cosmetics / Beauty | ~58% | Average for beauty retail (NYU Stern, Jan 2024) |
| Footwear | 50%–67% | Athletic lower; premium/fashion higher |
| Home Goods / Furniture | 30%–43% | Mass market closer to 43%; custom/specialty higher |
| Sporting Goods | ~41% | Average for sporting goods retail (NYU Stern, Jan 2024) |
| Electronics (accessories) | 50%–100% | Cables, cases, screen protectors |
| Electronics (core devices) | 7%–20% | Phones, laptops — structurally thin |
| Grocery (general merchandise) | 5%–25% | Overall store margins narrow |
| Grocery (prepared/deli) | 38%–50% | Highest-margin section in most grocery operations |
| General retail average | 30.9% | All retail (NYU Stern, Jan 2024) |
Note the electronics pattern: retailers deliberately cross-subsidize thin-margin core devices with high-margin accessories. A customer who buys a $1,000 laptop at 8% margin is expected to buy a case, cable, and screen protector at 80–100% margin. That blended transaction margin is the real business model.
If your gross margin is below the category average, investigate before concluding the category is simply low-margin. Most of the time, a gap between your expected and actual margin traces back to one of the pricing problems described below.
The Four Main Pricing Strategies
Keystone Pricing
Double the wholesale cost. A product that costs $10 wholesale sells for $20 retail. This produces exactly a 50% gross margin. It's the default starting point for general merchandise and most apparel, and it works when your category supports it.
Keystone fails in two directions: it under-prices in luxury and specialty categories where value perception far exceeds cost, and it over-prices in electronics and commodity categories where competition forces margins below 50%.
Cost-Plus Pricing
A more deliberate version of keystone: add up all costs (wholesale, freight, duties, a shrinkage allowance), then apply a target markup. This ensures per-unit profitability but anchors pricing to cost rather than to what the market will pay. It's the right foundation — but not the final step. After calculating your cost-plus floor, check where that price lands against what comparable products sell for and adjust accordingly.
Competitive Pricing
Prices are set relative to competitors — at parity, below (to compete on price), or above (if you can justify it through service, location, or curation). This is necessary on commodity items where customers comparison-shop. The risk: a competitor's price tells you what they charge, not whether they're profitable at it. Benchmarking against a low-margin competitor replicates their problem.
Value-Based Pricing
Prices reflect what customers will pay, not what the product costs. The hardest strategy to execute because it requires honest self-assessment of differentiation. Most appropriate for specialty retailers, private-label goods, artisan products, and items with genuine brand equity. A $40 candle made for $8 is priced on perceived value — and that's correct when customers are paying for something beyond the physical product.
Building a Retail Price That Works
The cleanest way to set a price is a four-step build-up:
Step 1: Calculate landed cost. Start with the supplier invoice price and add every cost to get the product to your shelf — inbound freight, import duties, and a shrinkage allowance (typically 1–3% of cost for physical retail, depending on category and security).
Step 2: Set your gross margin target. Based on your category and operating cost structure. A useful cross-check: take your total overhead (rent, wages not tied to specific items, utilities, technology, marketing) and divide by your expected annual revenue. If overhead is 40% of revenue, you need a gross margin meaningfully above 40% to produce any net margin at all.
Step 3: Calculate the price. Use Price = Landed Cost ÷ (1 − Target Gross Margin).
Step 4: Pressure-test against the market. Check what comparable products sell for at comparable retailers. If your calculated price is significantly above market on a price-transparent item, the math doesn't change — but you may need to revisit supplier cost or reconsider the product. If your calculated price is below market, you have room and should consider whether the product warrants it.
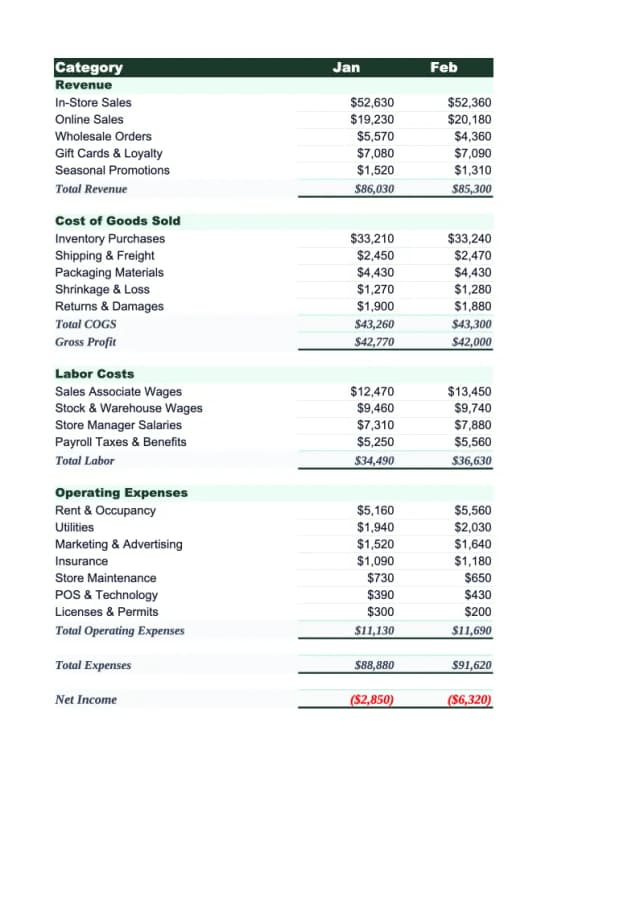
Tracking this math across your full assortment is where a Retail Income Statement Template earns its place — actual gross margin per category, versus what your pricing model assumed, month by month.
Need a ready-made budget template for your retail?
Download a pre-built spreadsheet with industry-specific categories, formulas, and formatting.
When to Discount — and When Not To
Cases where discounting makes sense
Clearing aging inventory. Recovering partial cost from a slow-moving product is better than a full write-off. The key is a graduated markdown strategy — starting at 15–20% and deepening only if the initial reduction doesn't move inventory — rather than going straight to a large discount. This preserves margin on units that would have sold at the first markdown level.
Structured first-purchase promotions. A 10–15% first-purchase discount can be effective if customer lifetime value justifies the margin cost. This works as a deliberate acquisition investment, not a permanent price concession.
Slow-period traffic drivers. A well-timed promotion during a predictably slow week can generate volume that, at lower margin, still contributes to fixed cost coverage. This is seasonal discounting used strategically, not reactively.
End-of-season clearance. Build the markdown schedule before the season, not after. If holiday inventory isn't cleared by mid-January, every week that passes makes the math worse. Our retail inventory management guide covers how to identify dead stock early and when graduated markdowns outperform deep cuts.
Cases where discounting erodes value
On your most differentiated products. Discounting a product with no close substitute signals the original price was arbitrary and trains customers to wait.
Habitually or without a defined end date. Perpetual sales destroy the reference price. Customers stop believing the "original" price is real and buy only on promotion.
When the margin math doesn't support it. A 20% discount on a product with a 30% gross margin leaves a 10% gross margin — almost certainly below what overhead recovery requires. Always run the margin math before approving a discount. The formula: Post-Discount Margin = 1 − [Cost ÷ (Original Price × (1 − Discount %))].
To compete on price against large-format or e-commerce operators. Amazon and national chains operate on cost structures a small retailer cannot replicate. Competing on price alone in commodity categories against those operators is not a viable long-term strategy.
Pricing Through the Seasons
Seasonal demand patterns affect pricing differently depending on category, but the underlying logic is consistent:
During peak demand, protect full-margin selling. Price sensitivity is lower and product urgency is higher. This is not the time to discount inventory that hasn't moved — check whether the issue is placement or product before adjusting price in peak season.
During shoulder and off-season periods, use pricing to clear inventory and drive traffic. The goal shifts from margin maximization to inventory recovery and fixed-cost coverage. Graduated markdowns outperform large single-step discounts because they preserve margin on units that would sell at the first reduction level.
Build seasonal pricing logic into your buying plan. If a product category has a 10-week full-price window before markdown pressure begins, buy accordingly. Overbuying into a compressed selling window creates forced discounting that was avoidable.
For retailers with significant seasonal variation — back-to-school, holiday, summer outdoor, Valentine's Day — the Retail KPI Dashboard makes it practical to track sell-through rate and gross margin by category week over week, which is when you actually need that data rather than discovering problems at month-end.
Common Pricing Mistakes
Not accounting for all landing costs. Focusing on the wholesale invoice while ignoring inbound freight, duties, shrinkage, and credit card fees. These costs are real. If they're not in the price, they come out of margin.
Setting prices once and leaving them. Supplier costs, wages, rent, and competitive positioning all change. A 5% supplier cost increase not passed through compounds into a 5% annual margin erosion. Review pricing at minimum annually; quarterly for categories with volatile input costs.
Treating all products at the same markup. Traffic-driving key items and high-margin impulse buys serve different roles in the store. Forcing the same markup on both misses the deliberate cross-subsidization logic that makes retail economics work.
Discounting too frequently. Running regular sales trains customers to wait for the next one. It also permanently erodes the perceived value of the original price. The instinct is understandable — discounts generate short-term volume — but the long-term cost is paid through every future transaction.
Underpricing to acquire new customers. Launch prices anchor expectations. Customers acquired cheaply are typically the hardest to retain at higher prices, and the low entry price becomes the psychological reference point they benchmark against forever.
Not tracking actual gross margin versus intended margin. A pricing model that looks correct on paper may not survive contact with actual operations — shrinkage, supplier cost creep, untracked discounts, and returns all widen the gap. Pull actual gross margin from your retail income statement quarterly and compare it to your pricing model's assumptions.
The Numbers to Track
Pricing decisions improve when you measure their results. Track these on a monthly basis:
Gross margin by category. Revenue minus cost of goods, by product category. Comparing this to your intended margin reveals where the pricing model is working and where it isn't.
Sell-through rate. Units sold divided by units received, by product and category. Low sell-through before the end of a selling season is the early warning sign that inventory bought at current pricing won't clear without markdown pressure.
Effective discount rate. Total discounts and promotions as a percentage of gross revenue. If this number is climbing quarter over quarter, your pricing strategy is becoming increasingly dependent on discounting to move inventory.
Net margin. The bottom line after all overhead. For general retail, target 5–15%. Margins below 5% leave almost no buffer for a slow period, an inventory write-off, or an unexpected fixed cost. The gap between your gross margin and net margin tells you what overhead is taking — and whether that overhead level is sustainable at your current revenue. Use our retail break-even calculator to find the exact revenue level where your current cost structure turns profitable.
The Retail Income Statement Template structures these metrics the way a retail P&L actually needs to work — with gross margin tracked by merchandise category, shrinkage separated as a line item, and the overhead section detailed enough to see where the gap between gross and net margin is going.
The Foundation
Pricing that produces consistent margin isn't about having the highest or lowest prices in the market. It's about knowing your costs well enough to set a floor, understanding your customer's price sensitivity well enough to find the ceiling, and having the discipline to stay between those two points.
Most small retailers who struggle with margins are operating somewhere between: prices set without knowing landed cost, margins measured imprecisely because markup and margin are being confused, or a discounting habit that has quietly become structural.
Running the landed cost calculation and the correct margin formula for your current prices is a one-hour exercise. Doing it for the first time almost always reveals a gap — either prices below what costs require, or margins below what overhead demands. Finding the gap is the prerequisite to fixing it.
Last updated: March 25, 2026
Frequently Asked Questions
Related Articles
Auto Repair Pricing Guide: How to Price Your Shop Profitably
How auto repair shop owners should price labor and parts — covering labor rate calculation, flat-rate hours, parts markup matrices, diagnostic fees, and the metrics that matter.
Cleaning Service Pricing Guide: How to Price Your Business Profitably
A practical guide to cleaning service pricing — covering hourly vs. flat rate vs. per square foot models, price benchmarks by service type, labor cost math, and the common mistakes that keep cleaning businesses from hitting their margin targets.
Construction Pricing Guide: How to Price Your Work Profitably
How contractors should price construction work — covering labor burden, overhead recovery, material markup, pricing methods, and the mistakes that quietly erode margin.
Electrical Pricing Guide: How to Price Your Work Profitably
How electricians and electrical contractors should price their work — covering hourly rates, flat-rate pricing, overhead recovery, material markup, and common mistakes that erode margin.
Hotel Sales Forecast: A Practical Example and Guide
How to build a hotel sales forecast — covering rooms, F&B, events revenue, key metrics like RevPAR and ADR, booking pace, and the rolling forecast structure that keeps you ahead.
Landscaping Pricing Guide: How to Price Your Work Profitably
A practical guide to landscaping pricing — covering hourly rates, per-square-foot benchmarks, overhead recovery, and the markup math that determines whether you're making money.