Retail Budget Template
Plan and track your retail store's finances with a budget template built for product-based businesses. Pre-loaded with COGS, inventory, labor, and occupancy categories.
What's Inside This Retail Budget Template
This template includes 4 worksheets, each designed for a specific part of your retail financial workflow:
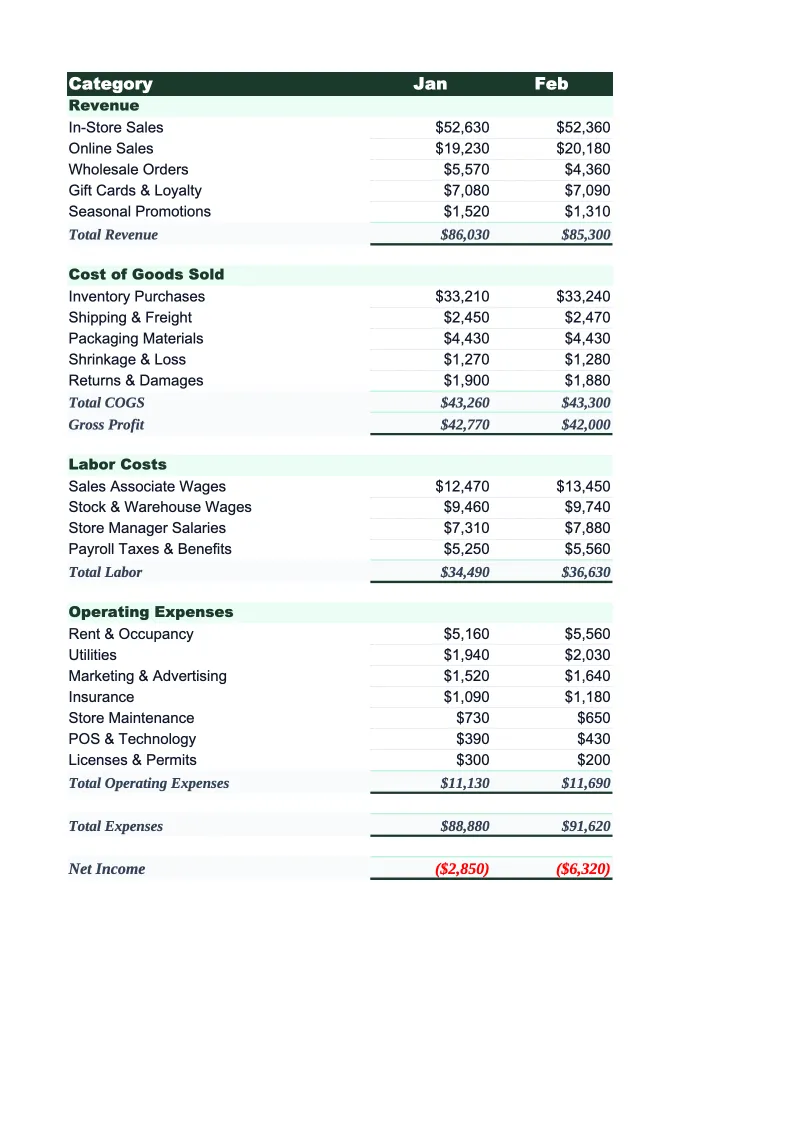
Monthly Budget
The core worksheet where you plan each month's revenue and expenses.
Annual Summary
A 12-month rollup that aggregates data from each monthly sheet automatically.
Budget vs Actual
Track what you planned against what actually came in and went out.
Dashboard
A visual overview with pre-built charts showing gross margin percentage, COGS as a share of revenue, monthly revenue trends, and expense breakdowns by category.
Retail Budget Template Features
- Revenue tracking split by in-store, online, and wholesale channels
- COGS and gross margin percentage auto-calculation
- Monthly budget with 12-month annual rollup
- Budget vs actual variance tracking with color-coded alerts
- Pre-loaded retail overhead categories: rent, shrinkage, payroll, marketing
- Visual dashboard with gross margin trend chart
How to Use This Retail Budget Spreadsheet
Getting started takes about 15 minutes. Download the .xlsx file and open it in Excel or Google Sheets — no macros or plugins required. Begin with the Monthly Budget sheet and review the pre-loaded revenue and expense categories. Most retail stores will recognize 80–90% of the categories immediately; add or rename the remaining lines to match your chart of accounts. If you sell across multiple channels (in-store plus an online shop, or wholesale plus direct retail), separate your revenue by channel from day one — it makes margin analysis much easier later.
Once the categories are set, enter your projected revenue and expenses for the current month. If this is your first budget, pull last month's bank statements and POS sales report to create a baseline. Don't worry about precision on the first pass — a rough plan you'll actually update beats a detailed plan you abandon. Copy the structure forward for remaining months, adjusting for your known seasonal patterns: bump Q4 revenue and COGS for holiday inventory, lower January projections to reflect the post-holiday slowdown.
15 minutes from download to your first budget
Download the template, plug in your numbers, and see your store's full financial picture — monthly budget, annual rollup, and variance tracking included.
Why Every Retail Store Needs a Budget Template
Retail budgeting is harder than it looks because the two biggest costs — inventory and labor — both move constantly. COGS fluctuates with supplier pricing, your product mix, and how well you manage markdowns. Labor shifts with foot traffic, seasonal hiring, and turnover. And unlike service businesses, retail carries inventory risk: money sitting on shelves that isn't selling is money not available to pay rent. Most store owners with tight margins (typical retail net margins run 2–6%) need to know exactly where every dollar is going, and they need to know it before month-end, not after.
A proper retail budget separates the costs that scale with sales from the ones that don't. COGS is your biggest variable cost — it should move as a consistent percentage of revenue (gross margins for retail typically run 40–60%, depending on the product category). Labor in retail is semi-variable: a baseline of full-time staff is fixed, but seasonal and part-time hours flex with traffic. Occupancy costs — rent, utilities, insurance — are fixed and non-negotiable, which means they eat a larger share of revenue in slow months. Tracking these three cost buckets separately tells you whether a bad month was a revenue problem, a COGS problem, or an overhead problem — and the fix is different for each.
Retail Industry at a Glance
Financial templates built for retail businesses — from independent boutiques to specialty stores. Pre-loaded with product cost tracking, wholesale invoicing, and retail-specific KPIs.
Revenue Drivers
- In-store sales
- Online/e-commerce sales
- Wholesale orders
- Custom and special orders
Key Cost Categories
- Cost of goods sold
- Labor (sales staff)
- Rent & occupancy
- Inventory shrinkage
- Marketing & advertising
- Shipping & fulfillment
Typical Margins
Gross: 40-60% · Net: 2-6%
Seasonality
Q4 holiday season typically accounts for 20-30% of annual revenue; back-to-school (August) and spring sales are secondary peaks.
Key Performance Indicators
Retail Budget Template FAQ
More Retail Templates
Retail Balance Sheet Template for Excel
$29
Retail Business Plan Template for Excel
$39
Retail Cash Flow Template for Excel
$29
Retail Expense Tracker Template for Excel
$29
Retail Financial Model Template for Excel
$29
Retail Income Statement Template for Excel
$29
Retail Invoice Template for Excel
$29
Retail KPI Dashboard Template for Excel
$29
Retail P&L Template for Excel
$29
Retail Pro Forma Template for Excel
$29
Retail Project Budget Template for Excel
$29
Retail Sales Forecast Template for Excel
$29
Retail Business Valuation Template for Excel
$29
Retail Budget Template
$29