Retail Inventory Management: Best Practices That Work
Practical retail inventory management best practices — covering ABC analysis, safety stock, cycle counting, reorder points, and reducing carrying costs.
Most retail inventory problems come from the same root cause: not knowing what you have, where it is, or when you'll need more of it. The result is predictable — stockouts on your best sellers and dead stock accumulating on the shelves that don't turn.
Good inventory management doesn't require expensive software. It requires consistent systems for the decisions you make every week: what to order, how much to hold, and when to act. Here are the practices that make the biggest difference.
Classify Your Inventory with ABC Analysis
Before you can manage inventory well, you need to know which items deserve the most attention. ABC analysis gives you that structure.
Divide your SKUs into three tiers based on their contribution to revenue and profit:
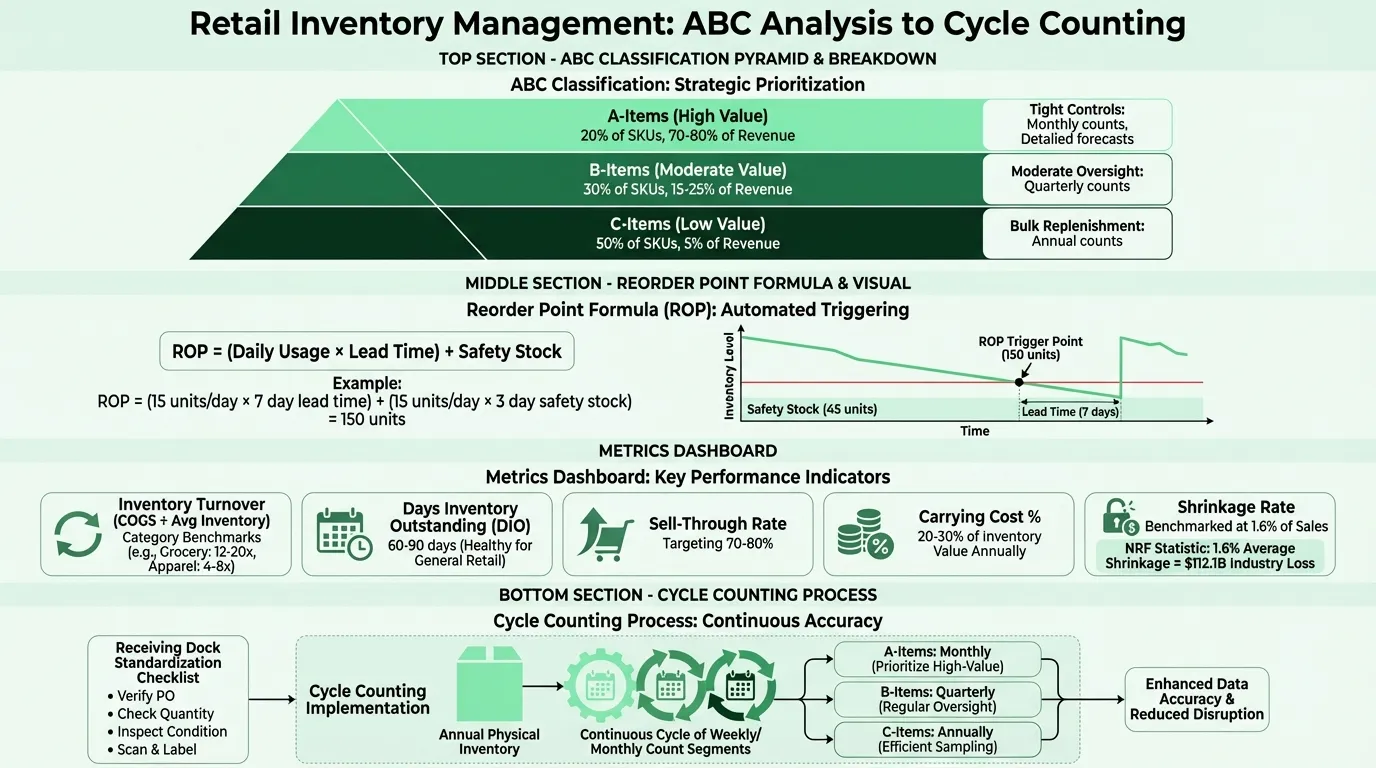
- A-items: Roughly 20% of SKUs that generate 70–80% of revenue. These get tight controls — accurate demand forecasts, frequent cycle counts, close supplier relationships, and precise reorder points. A stockout on an A-item hurts your business immediately.
- B-items: The middle tier, typically 30% of SKUs and 15–25% of revenue. Moderate oversight and standard replenishment processes.
- C-items: The largest group by count (often 50% of SKUs) but only about 5% of revenue. Manage these with bulk replenishment and less frequent counting. Don't spend A-item attention on C-item stock.
The mistake most retailers make is treating all SKUs equally. Spending the same replenishment effort on a slow-moving accessory as on your top-selling product wastes time and causes your high-value items to be under-managed.
Run this analysis by pulling last year's sales data by SKU. Sort by gross profit contribution. The top 20% of that list are your A-items. Revisit the classification twice a year — items move between tiers as trends shift.
Set Reorder Points Based on Data, Not Habit
A reorder point (ROP) is the inventory level at which you place a new order. Without one, you're reacting to stockouts after they happen. With one, you're reordering in time to receive stock before you run out.
The formula:
ROP = (Average daily demand × Supplier lead time in days) + Safety stock
Example: You sell 15 units of a product per day on average. Your supplier takes 7 days to deliver. You want 3 days of safety stock.
ROP = (15 × 7) + (15 × 3) = 105 + 45 = 150 units
When your on-hand quantity hits 150, you place the order. By the time the shipment arrives 7 days later, you'll have 45 units left — your safety stock buffer.
Two common errors undermine this system. First, setting ROPs once and never updating them. Demand patterns shift seasonally; a ROP set in January is likely wrong by August. Second, calculating lead time based on best-case delivery rather than average delivery. Use your actual average lead time, including delays.
Calculate Safety Stock for Your Fastest Movers
Safety stock protects you against two risks: demand that runs higher than expected and supplier deliveries that arrive later than expected. For your A-items, use a proper calculation rather than a rough guess.
A practical formula that doesn't require statistics expertise:
Safety Stock = (Max daily demand − Avg daily demand) × Max lead time in days
Example: Your average daily sales for a SKU are 12 units, but during peak periods you've seen 20 units/day. Your supplier normally delivers in 5 days but has taken as long as 9 days.
Safety Stock = (20 − 12) × 9 = 72 units
For most retailers, this is enough precision. Holding 72 units as a buffer costs money — carrying costs typically run 20–30% of inventory value annually, according to APQC benchmarks — so don't apply this formula to every SKU. Reserve it for your A-items and high-margin products where a stockout has the highest cost.
Switch from Annual Counts to Cycle Counting
An annual physical inventory count tells you where your inventory stands once a year. By the time you find a discrepancy — say, 200 missing units of a product — you may have been reordering incorrectly for months.
Cycle counting fixes this by making inventory counting a continuous process rather than an annual event:
- Divide your inventory into segments (by aisle, by ABC tier, by category)
- Count a different segment each week or each day
- Reconcile discrepancies immediately
With cycle counting, A-items might be counted monthly, B-items quarterly, and C-items twice a year. You still get accurate inventory data without shutting down operations for a full count.
The NRF's 2023 National Retail Security Survey reported average retail shrink at 1.6% of sales — $112.1 billion in industry losses for FY2022. Regular cycle counts catch shrinkage before it compounds. A discrepancy that takes 11 months to surface in an annual count is a 6-week problem with weekly cycle counts.

Need a ready-made expense tracker template for your retail?
Download a pre-built spreadsheet with industry-specific categories, formulas, and formatting.
Use FIFO to Keep Inventory Fresh
FIFO (First-In, First-Out) means the oldest inventory sells first. This matters most for products with expiration dates — food, cosmetics, pharmaceuticals — but it's a good habit across most retail categories.
Why it matters beyond perishables: products cycle through packaging updates, formula changes, or trend cycles. If you're always selling your oldest stock first, you reduce the risk of getting stuck with discontinued or outdated product at the back of the shelf.
Operationally, FIFO means:
- New stock goes behind or underneath existing stock when shelves are restocked
- Receiving dock processes ensure new arrivals don't jump ahead of existing inventory
- Storage layout makes it easy for staff to pull from the front or top first
This is mostly a training and process issue, not a technology one. A clear standard operating procedure for stocking shelves and warehouse aisles is enough for most retailers.
Track Carrying Costs and Eliminate Dead Stock
Every unit sitting in your stockroom or warehouse costs money. Carrying costs include storage space, insurance, handling labor, capital tied up, and the risk of obsolescence or damage. Most benchmarks put carrying costs at 20–30% of inventory value annually.
That means $100,000 in average inventory costs you $20,000–$30,000 per year just to hold. Carrying slow-moving inventory isn't neutral — it's expensive. These carrying costs flow directly into your retail balance sheet as inflated inventory values that compress your current ratio.
Dead stock — items with no sales in 90–180 days — should be reviewed and cleared on a regular schedule. Options for moving dead stock:
- Markdown: Price reduction to accelerate sales. Better to recover 40% of cost than carry the item another 6 months.
- Bundle with faster movers: Package a slow item with a popular one to move it without deep discounts.
- Return to supplier: If you have a return agreement, use it before the product ages further.
- Write down: Items that can't be moved should be written off. Holding them at full cost inflates your inventory balance and understates your carrying burden.
Track sell-through rate by SKU to identify dead stock early. A SKU with a sell-through rate below 30% after a normal selling season is a candidate for markdown or return, not ongoing shelf space. When markdowns are unavoidable, a clear retail pricing strategy with graduated discounts preserves more margin than reactive deep cuts.
Standardize Your Receiving Process
A significant portion of inventory discrepancies trace back to the receiving dock. Vendor short-shipments, miscounts, and data entry errors at intake create phantom inventory — your system shows stock you don't actually have. When you reorder based on phantom inventory, you're building on a false foundation.
A standardized receiving process prevents most of these errors:
- Count every shipment. Don't assume the packing slip is accurate. Count units against the purchase order and the packing slip independently.
- Use barcode scanning. Scanning items at receiving eliminates manual SKU entry errors and creates an automatic paper trail.
- Inspect for damage immediately. Damage claims must be filed promptly. Once product is shelved, it's much harder to prove the damage happened in transit.
- Enter receipts in the same session. Receiving data that sits on paper for 24–48 hours before being entered creates temporary blind spots in your inventory system.
A two-person receiving process — one counting, one verifying against the purchase order — catches discrepancies at the point where they're easiest to resolve (before the truck leaves). For tracking the costs that flow from receiving errors, the Retail Expense Tracker provides a structured format for logging shrinkage and receiving variances.
The Metrics That Show Whether It's Working
Inventory management decisions need feedback loops. These are the metrics worth tracking consistently:
| Metric | What It Tells You | Formula |
|---|---|---|
| Inventory Turnover | How efficiently you're converting stock to sales | COGS ÷ Average Inventory |
| Days Inventory Outstanding (DIO) | How many days stock sits before selling | (Avg Inventory ÷ COGS) × 365 |
| Sell-Through Rate | % of received stock that sold in a period | Units Sold ÷ Units Received × 100 |
| Stockout Rate | How often items are out of stock when customers want them | Stockout events ÷ Total SKUs tracked |
| Carrying Cost % | Cost of holding inventory as % of its value | Total carrying costs ÷ Total inventory value |
| Shrinkage Rate | Inventory lost to theft, damage, or error | (Recorded − Physical count) ÷ Sales × 100 |
For a broader view of how inventory performance connects to financial results — gross margin, GMROI, and category-level profitability — the retail KPI example post covers benchmarks by category. If you're tracking retail financials across statements, the Retail Income Statement Template and Retail KPI Dashboard provide structured formats for measuring inventory-driven profitability alongside other operational metrics.
What Good Inventory Management Actually Looks Like
A well-managed retail inventory isn't the one with the highest turnover or the lowest stock levels. It's the one where the right items are in stock when customers want them, slow movers get moved before they turn into dead stock, and the total cost of holding and replenishing inventory is kept at a level the margin can support.
The practices above aren't complex in isolation. The challenge is doing them consistently — updating reorder points when demand shifts, counting inventory regularly instead of once a year, clearing dead stock before it compounds.
Most retail inventory problems don't appear suddenly. They accumulate slowly through skipped counts, outdated reorder points, and dead stock that never got marked down. A consistent weekly or monthly review of your key inventory metrics catches most of these before they become expensive.
Last updated: March 25, 2026
Frequently Asked Questions
Related Articles
Auto Repair Pricing Guide: How to Price Your Shop Profitably
How auto repair shop owners should price labor and parts — covering labor rate calculation, flat-rate hours, parts markup matrices, diagnostic fees, and the metrics that matter.
Cleaning Service Pricing Guide: How to Price Your Business Profitably
A practical guide to cleaning service pricing — covering hourly vs. flat rate vs. per square foot models, price benchmarks by service type, labor cost math, and the common mistakes that keep cleaning businesses from hitting their margin targets.
Construction Pricing Guide: How to Price Your Work Profitably
How contractors should price construction work — covering labor burden, overhead recovery, material markup, pricing methods, and the mistakes that quietly erode margin.
Electrical Pricing Guide: How to Price Your Work Profitably
How electricians and electrical contractors should price their work — covering hourly rates, flat-rate pricing, overhead recovery, material markup, and common mistakes that erode margin.
Hotel Sales Forecast: A Practical Example and Guide
How to build a hotel sales forecast — covering rooms, F&B, events revenue, key metrics like RevPAR and ADR, booking pace, and the rolling forecast structure that keeps you ahead.
Landscaping Pricing Guide: How to Price Your Work Profitably
A practical guide to landscaping pricing — covering hourly rates, per-square-foot benchmarks, overhead recovery, and the markup math that determines whether you're making money.