Retail KPI Dashboard Template
Track sales per square foot, inventory turnover, gross margin, shrinkage, and the other KPIs that determine whether your retail store is actually profitable.
What's Inside This Retail KPI Dashboard Template
This template includes 5 worksheets, each designed for a specific part of your retail financial workflow:
KPI Dashboard
The main visual overview showing your store's critical performance metrics at a glance.
Daily Sales Log
A structured daily entry sheet for tracking transactions, revenue, units sold, and customer counts.
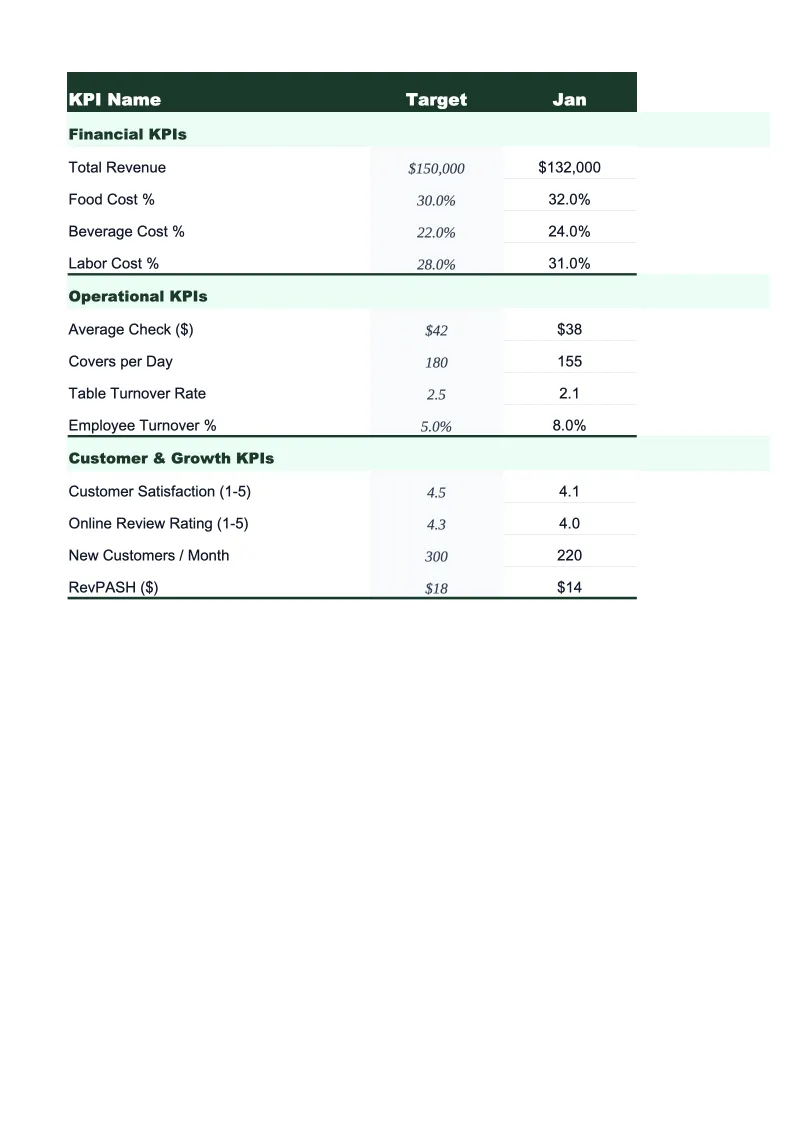
Monthly Scorecard
Set your targets for each KPI at the start of the month, then enter actuals as you close the period.
Inventory Tracker
A dedicated worksheet for monitoring inventory health — the area where most retail businesses lose the most untracked margin.
12-Month Trends
A rolling 12-month view of your most important KPIs plotted as line charts.
Retail KPI Dashboard Features
- 24 pre-loaded retail KPIs including gross margin %, sales per sq ft, and inventory turnover
- Color-coded status indicators — green/yellow/red against your targets
- Daily sales log with automatic rollup to weekly and monthly totals
- Inventory tracker with sell-through rate and aging flags by category
- Same-store sales growth calculation with year-over-year comparison
- Shrinkage and return rate tracking with benchmark ranges built in
How to Use This Retail KPI Spreadsheet
Start with the Monthly Scorecard and set your targets for each KPI. If you don't have established targets yet, the template includes benchmark ranges based on retail industry standards — gross margin cells, for example, are annotated with typical ranges by retail format (specialty retail, apparel, general merchandise) so you have a starting point. Setting targets for a new period takes about 15 minutes, and you only need to do it once per month.
Enter your daily sales numbers in the Daily Sales Log each evening after you pull your POS report. Revenue, transaction count, and units sold go in by day; if your POS tracks foot traffic, add that too and the sheet will calculate your conversion rate automatically. Inventory entries can be done weekly or after each physical count — the Inventory Tracker sheet is built around periodic counts rather than perpetual inventory, so you don't need an inventory management system to use it.
15 minutes from download to your first KPI review
Download the template, set your targets, and start tracking the metrics that determine whether your retail store is actually hitting its numbers.
Why Every Retail Store Needs a KPI Dashboard
Retail is a business of thin margins and fast-moving decisions. The difference between a profitable quarter and a loss often comes down to a 2–3% swing in gross margin, an inventory category that aged out instead of selling through, or a conversion rate that slipped because the floor wasn't staffed correctly on weekends. The problem is that most retailers don't see these numbers until the end of the month — by which time the inventory is already marked down, the payroll is already run, and the margin is already gone. A KPI dashboard changes that by surfacing the same data daily and weekly, while there's still time to act.
The KPIs that matter most in retail fall into three buckets. Profitability metrics — gross margin percentage, sales per square foot, and sales per employee — tell you whether the business model is working and whether your space and people are generating adequate return. Inventory metrics — inventory turnover, sell-through rate, and weeks of supply — tell you whether your buying decisions are translating into sales or sitting on shelves tying up cash. Customer metrics — average transaction value, units per transaction, and conversion rate — tell you whether the in-store experience is working. Gross margin for specialty retail typically runs 40–55%; general merchandise 30–40%; grocery 25–30%. Inventory turnover should be 4–6 turns per year for most specialty formats, higher for fast-fashion or consumables.
Retail Industry at a Glance
Financial templates built for retail businesses — from independent boutiques to specialty stores. Pre-loaded with product cost tracking, wholesale invoicing, and retail-specific KPIs.
Revenue Drivers
- In-store sales
- Online/e-commerce sales
- Wholesale orders
- Custom and special orders
Key Cost Categories
- Cost of goods sold
- Labor (sales staff)
- Rent & occupancy
- Inventory shrinkage
- Marketing & advertising
- Shipping & fulfillment
Typical Margins
Gross: 40-60% · Net: 2-6%
Seasonality
Q4 holiday season typically accounts for 20-30% of annual revenue; back-to-school (August) and spring sales are secondary peaks.
Key Performance Indicators
Retail KPI Dashboard Template FAQ
More Retail Templates
Retail Balance Sheet Template for Excel
$29
Retail Budget Template for Excel
$29
Retail Business Plan Template for Excel
$39
Retail Cash Flow Template for Excel
$29
Retail Expense Tracker Template for Excel
$29
Retail Financial Model Template for Excel
$29
Retail Income Statement Template for Excel
$29
Retail Invoice Template for Excel
$29
Retail P&L Template for Excel
$29
Retail Pro Forma Template for Excel
$29
Retail Project Budget Template for Excel
$29
Retail Sales Forecast Template for Excel
$29
Retail Business Valuation Template for Excel
$29
More KPI Dashboard Templates
Retail KPI Dashboard Template
$29