Retail Income Statement Template
A retail income statement template with merchandise cost, shrinkage, occupancy, and gross margin calculations built in — so you can see your store's actual profitability without building a spreadsheet from scratch.
What's Inside This Retail Income Statement Template
This template includes 4 worksheets, each designed for a specific part of your retail financial workflow:
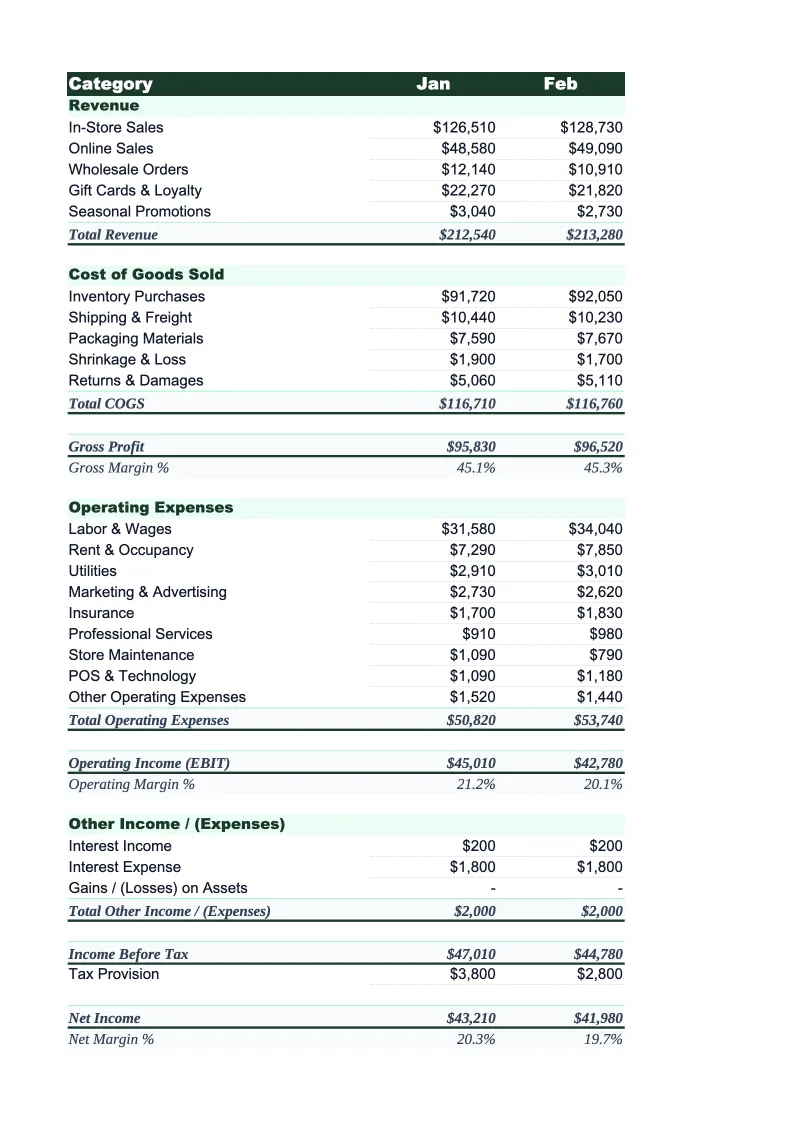
Monthly Income Statement
The core P&L worksheet structured the way retail accountants build them.
Annual Summary
A 12-month rollup that consolidates your monthly statements into a single view.
Key Ratios
A dedicated worksheet that tracks the financial ratios that drive retail profitability.
Channel Breakdown
An optional worksheet that separates your income statement by sales channel — in-store, online, and wholesale.
Retail Income Statement Template Features
- Revenue split by in-store, online, and wholesale channels with per-channel margin calculations
- COGS tracks landed merchandise cost including freight-in, with gross margin auto-calculated
- Inventory shrinkage tracked as a separate line item to show its real margin impact
- Labor, occupancy, marketing, and fulfillment expenses broken into industry-standard categories
- 12-month annual summary with year-to-date totals and holiday season visibility
- Key ratio tracker with gross margin %, shrinkage %, and occupancy ratio benchmarks
How to Use This Retail Income Statement Spreadsheet
Start by downloading the .xlsx file and opening it in Excel or Google Sheets — no macros or add-ins required. Open the Monthly Income Statement sheet and review the pre-loaded categories. Most retail stores will keep the structure largely intact: adjust the revenue line items to match your channels (remove wholesale if you don't sell to other retailers, add a line for gift cards if applicable), and tweak any expense labels that don't match your chart of accounts. This setup takes about 10–15 minutes and you only need to do it once.
Each month, enter your actual revenue and cost figures from your POS system, accounting software, and bank statements. Work top to bottom — start with revenue by channel, then enter the cost of merchandise sold, then fill in each operating expense group. Gross profit, gross margin percentage, EBITDA, and net income all calculate automatically. Once the monthly sheet is filled in, the Annual Summary and Key Ratios sheets update without any additional steps. If you track shrinkage separately in your inventory system, enter it in the dedicated line item so it doesn't get hidden inside COGS.
15 minutes from download to your first income statement
Download the template, enter your revenue and costs, and see your store's actual margins — gross margin percentage, shrinkage impact, and net income all calculated automatically.
Why Every Retail Store Needs a Proper Income Statement
Retail operates on some of the thinnest net margins in any industry — typically 2–6% — which means that small shifts in gross margin or cost structure have outsized effects on profitability. A store running 45% gross margin with $500,000 in annual revenue has $225,000 to cover all operating costs and profit. If gross margin slips to 42% due to aggressive discounting or rising merchandise costs, that's $15,000 less to work with before a single expense changes. Without a monthly income statement, those shifts are invisible until they show up in cash flow.
A retail income statement follows a structure shaped by how the industry actually works. Revenue should be broken out by channel because in-store, online, and wholesale sales have fundamentally different cost structures — you can't manage them as a single number. COGS captures the actual landed cost of merchandise sold, not just the invoice price: freight-in, import duties, and any vendor allowances should all roll through here. Gross margin — the difference between sales and merchandise cost — is the most important single metric in retail and should be tracked monthly, not just annually. Below the gross profit line, occupancy costs deserve their own grouping because they're fixed and large; labor is your biggest variable cost; and shrinkage needs its own line because it's both an inventory management issue and a profitability issue.
Retail Industry at a Glance
Financial templates built for retail businesses — from independent boutiques to specialty stores. Pre-loaded with product cost tracking, wholesale invoicing, and retail-specific KPIs.
Revenue Drivers
- In-store sales
- Online/e-commerce sales
- Wholesale orders
- Custom and special orders
Key Cost Categories
- Cost of goods sold
- Labor (sales staff)
- Rent & occupancy
- Inventory shrinkage
- Marketing & advertising
- Shipping & fulfillment
Typical Margins
Gross: 40-60% · Net: 2-6%
Seasonality
Q4 holiday season typically accounts for 20-30% of annual revenue; back-to-school (August) and spring sales are secondary peaks.
Key Performance Indicators
Retail Income Statement Template FAQ
More Retail Templates
Retail Balance Sheet Template for Excel
$29
Retail Budget Template for Excel
$29
Retail Business Plan Template for Excel
$39
Retail Cash Flow Template for Excel
$29
Retail Expense Tracker Template for Excel
$29
Retail Financial Model Template for Excel
$29
Retail Invoice Template for Excel
$29
Retail KPI Dashboard Template for Excel
$29
Retail P&L Template for Excel
$29
Retail Pro Forma Template for Excel
$29
Retail Project Budget Template for Excel
$29
Retail Sales Forecast Template for Excel
$29
Retail Business Valuation Template for Excel
$29
More Income Statement Templates
Accounting Firm Income Statement Template for Excel
$29
Auto Repair Income Statement Template for Excel
$29
Car Wash Income Statement Template for Excel
$29
Church Income Statement Template for Excel
$29
Cleaning Service Income Statement Template for Excel
$29
Coffee Shop Income Statement Template for Excel
$29
Retail Income Statement Template
$29