Real Estate Pricing Guide: How to Price a Property Right
How to price a home for sale — covering CMAs, pricing strategies, common seller mistakes, and the market data that determines where a property should be listed.
The listing price is the single most consequential decision in any real estate transaction. Get it right and you generate competition, maximize net proceeds, and close quickly. Get it wrong and you accumulate days on market that signal problems to buyers — a compounding mistake that's difficult to recover from.
Here's what actually drives property pricing and how experienced agents build their approach.
The Comparative Market Analysis: Where Pricing Starts
Every property pricing decision starts with the comparative market analysis (CMA). A CMA estimates a property's market value by analyzing what similar properties have actually sold for, typically within the last 60–90 days in the same area.
A quality CMA uses 5–10 comparable sales ("comps") that match on:
- Location — same neighborhood or comparable submarkets, usually within 0.5–1 mile
- Size — similar square footage, bedroom and bathroom count
- Property type — detached single-family vs. attached, condo vs. townhouse
- Condition and age — renovated vs. dated, newer construction vs. older
- Lot characteristics — size, orientation, backing to green space vs. road
Agents adjust comp prices up or down for differences: a comp without a garage, a smaller lot, or dated finishes gets adjusted relative to the subject property. The result is a price range — typically a spread of $20,000–$50,000 — not a single number. Where within that range the agent positions the listing depends on market conditions.
An important nuance: the CMA is not an appraisal. It has no lender standing. But a well-constructed CMA by an experienced local agent closely mirrors what a licensed appraiser's comps will produce — because both are using the same source data (MLS sold records) and the same basic methodology.
Three Pricing Strategies (and When to Use Each)
Once the CMA establishes a value range, agents typically recommend one of three positioning strategies:
Price at market value. List at the midpoint of what the comps support. This attracts qualified buyers from the start and minimizes unnecessary days on market. The right approach when inventory is balanced and you want a predictable, clean transaction.
Price slightly below market. A deliberate strategy to generate multiple offers. Listing 2–5% below the estimated market value concentrates buyer interest, often producing a bidding war that pushes the final sale price above asking. This approach requires confidence in the local market and the right pricing environment — it backfires when buyer demand is soft, leaving you simply at a below-market list price with no competition to push it up.
Price above market. Appropriate only for highly unique properties, specific luxury segments, or when a seller has time flexibility and low urgency. In most market conditions, this approach extends days on market and ultimately costs sellers more than they gained by starting high.
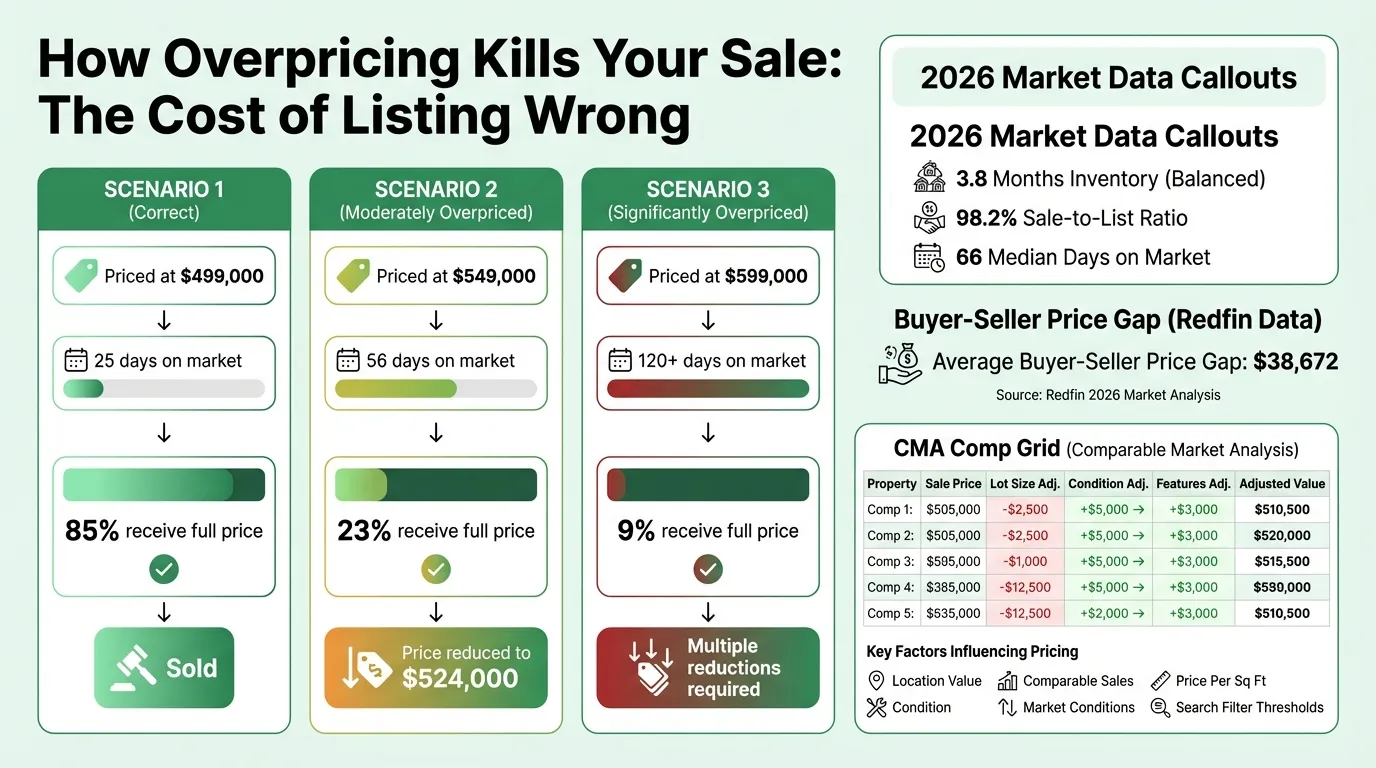
In February 2026, only 22.5% of homes nationwide sold above list price — down from 51% in the prior year. The strategy of pricing below to trigger multiple offers works in competitive inventory environments; in today's more balanced market, many agents have shifted back toward pricing accurately at or very near market value.
Key Factors That Drive Property Value
Understanding what moves the CMA helps both agents and sellers make sense of the resulting price range.
Location. The most influential factor and the one sellers can't change. Proximity to employment centers, quality school districts, transit access, parks, and shopping produces measurable premiums. Conversely, proximity to noise sources (highways, flight paths), industrial areas, or high-traffic streets creates discounts. Within the same subdivision, a lot backing to green space can command 5–10% more than the same floor plan backing to a commercial property.
Comparable sales. Appraisers and agents anchor value to what buyers have actually paid for similar properties. No subjective factor — renovation pride, emotional attachment, what you paid — overrides what the market has demonstrated it will pay for homes like yours.
Size and usable square footage. Price per square foot is the primary comparison metric. Finished above-grade square footage counts most; finished basements count at a discount; unfinished space largely doesn't count. Bedroom and bathroom count drives tier pricing independently of square footage — a four-bedroom in a three-bedroom neighborhood commands a premium.
Condition and systems. Move-in ready commands a premium over deferred maintenance. Buyers discount heavily for known issues (roof at end of life, aging HVAC, foundation cracks) because they face contractor headaches and unknown final costs. A dated but functional 1990s kitchen creates a smaller discount than a non-functional heating system. Fresh paint, clean carpets, and visible maintenance signal lower buyer risk even when no major updates have occurred.
Market conditions at time of listing. Months of supply is the clearest indicator of pricing pressure. Below 3 months of inventory is a seller's market; above 6 months is a buyer's market. As of February 2026, national inventory sat at 3.8 months — a balanced market with mild pressure toward sellers in well-priced, desirable segments. In softer submarkets, the same property is worth less simply because more alternatives exist.
Search filter thresholds. Buyers use price filters in increments of $25,000–$50,000. A home priced at $505,000 is invisible to every buyer filtering "under $500,000." The difference between $499,000 and $505,000 is $6,000 in list price but potentially several dozen fewer showings. Agents who understand how platforms display search results position listings to maximize the buyer pool, not to end in a round number.
The Market Numbers Behind Pricing Decisions
Current market data provides the context any pricing decision needs.
The national median existing-home sale price was $398,000 in February 2026, with homes spending a median of 66 days on market — 9 days longer than the same period a year prior. The national sale-to-list price ratio sat at 98.2%, meaning homes are selling at a small discount to asking price on average.
Perhaps the most telling figure from 2025: Redfin data showed the typical seller was asking $38,672 more than buyers were willing to pay — a 9% gap, the largest since May 2020. This occurred because sellers anchored to 2024 appreciation while buyers hit affordability walls driven by elevated mortgage rates. List prices grew 6.2% year-over-year in early 2025; sale prices grew only 2.5%.
That gap is a pricing mistake at scale. The sellers who experienced it weren't in especially unusual situations — they were relying on stale comps or emotional price anchoring rather than current market data. For investment properties, running the numbers through a real estate financial model exposes whether the asking price delivers acceptable returns at current cap rates.
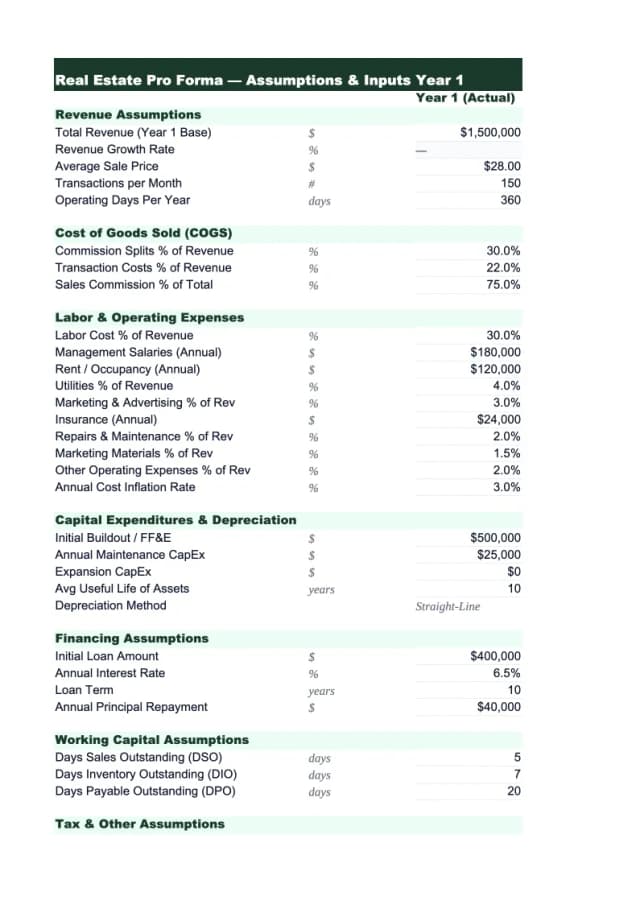
Need a ready-made pro forma template for your real estate?
Download a pre-built spreadsheet with industry-specific categories, formulas, and formatting.
Common Pricing Mistakes That Cost Sellers Money
Pricing based on what you need, not what the market supports. Listing at a price that covers a mortgage payoff, funds a down payment on the next purchase, or recoups renovation costs is a category error. The market doesn't care about a seller's financial needs. Buyers pay market value, full stop.
Using stale comps. A comp from 12 months ago in a changing market is not a reliable basis for today's listing price. In a market that softened through 2025, sellers using 2024 comps systematically overpriced their homes. Agents should anchor to the most recent 60–90 days of sold data and adjust directionally for market movement.
Not acting quickly enough on feedback. The first 10–14 days on market generate the highest volume of buyer traffic — people who have been watching inventory and act immediately on new listings. If that window passes without serious showings, something about the listing is wrong. Price is usually the primary variable. Waiting six weeks before acknowledging the problem wastes the highest-value marketing period.
Appraisal blind spots. An agent can list a property at any price, but a lender will only loan up to the appraised value. A contract at $520,000 on a property that appraises at $485,000 creates a $35,000 appraisal gap that the buyer must cover in cash or the deal falls apart. Agents who don't reality-check list price against what an appraiser's comps will support set up transactions to fail.
Over-improving beyond the neighborhood ceiling. Renovation ROI is not dollar-for-dollar. A $100,000 kitchen renovation in a neighborhood where comparable homes cap at $380,000 does not produce a $480,000 home — it produces a $395,000 home with an exceptional kitchen. The local comp ceiling constrains price regardless of what improvements cost. For sellers considering pre-listing renovations, the relevant question is: what will an appraiser actually credit for this? Run the expected spend through the real estate markup calculator to see the implied margin on any renovation-to-resale scenario.
Pricing for Different Property Types
Pricing mechanics vary by property segment:
Entry-level and mid-market single-family. Comps are usually available and comparable; the CMA methodology is most reliable here. Buyers are often financing at conventional loan limits and are sensitive to appraisal gaps. Pricing accuracy is highest-stakes because buyer pools are largest but also most price-sensitive.
Luxury residential. Fewer comps, more subjective features, longer marketing times. Pricing relies more on price-per-square-foot analysis with larger adjustments for unique attributes. Days on market expectations are different — 90–180+ days is normal for high-end properties in many markets. Urgency-based pricing discounts are more damaging in luxury because they signal weakness to a smaller, more sophisticated buyer pool.
Multi-family and investment property. Pricing is driven by income approach (capitalization rate applied to net operating income) more than comparable sales. What matters to an investor buyer is the cash-on-cash return and whether the cap rate aligns with the local market. The Real Estate Financial Model Template provides the structure for running these numbers from the seller's side — particularly useful for presenting investment property financials to prospective buyers.
New construction. Builders price by monitoring competition within the same submarket and adjusting based on absorption rate (how many units per month are selling). Spec homes may be discounted to move; custom homes are priced on cost-plus with margin. The dynamics are different from resale because buyers are comparing new vs. new, not new vs. existing.
Pricing and the Financial Model
For investment properties, accurate pricing requires the same financial analysis a buyer will run. A seller who can present a complete income and expense model — current rents, vacancy history, operating expenses, NOI, and implied cap rate — gives institutional and sophisticated buyers less room to discount the asking price on uncertainty grounds.
The Real Estate Pro Forma Template provides a framework for building this out, and the Real Estate Valuation Template applies the cap rate and discounted cash flow methods buyers use to arrive at their offer price. Running both before listing an investment property tells you whether your asking price will survive the due diligence process — or whether a buyer will renegotiate down after reviewing the actuals.
When to Adjust the Price
A price reduction is not a failure — it's information from the market being incorporated into the strategy. The mistake is ignoring the signal or waiting too long to act on it.
Standard guidance: if a properly marketed listing hasn't generated serious showings or offers within 14 days, a price adjustment should be on the table immediately. The typical first reduction is 3–5% — enough to move into a new buyer search tier or attract buyers who've seen the listing but haven't acted. A second reduction may follow if the first doesn't generate activity within another 7–10 days.
What agents try to avoid is the slow decline — a series of small reductions over several months that never get the price to a level that creates urgency. A listing at $499,000 after six months of $10,000 incremental reductions from $549,000 carries the stigma of 180+ days on market. The same $499,000 listed from the start would have sold in weeks.
The pricing decision gets made twice: when you set the list price, and when you decide how quickly to respond to what the market tells you.
Last updated: March 25, 2026
Frequently Asked Questions
Related Articles
Auto Repair Pricing Guide: How to Price Your Shop Profitably
How auto repair shop owners should price labor and parts — covering labor rate calculation, flat-rate hours, parts markup matrices, diagnostic fees, and the metrics that matter.
Cleaning Service Pricing Guide: How to Price Your Business Profitably
A practical guide to cleaning service pricing — covering hourly vs. flat rate vs. per square foot models, price benchmarks by service type, labor cost math, and the common mistakes that keep cleaning businesses from hitting their margin targets.
Construction Pricing Guide: How to Price Your Work Profitably
How contractors should price construction work — covering labor burden, overhead recovery, material markup, pricing methods, and the mistakes that quietly erode margin.
Electrical Pricing Guide: How to Price Your Work Profitably
How electricians and electrical contractors should price their work — covering hourly rates, flat-rate pricing, overhead recovery, material markup, and common mistakes that erode margin.
Hotel Sales Forecast: A Practical Example and Guide
How to build a hotel sales forecast — covering rooms, F&B, events revenue, key metrics like RevPAR and ADR, booking pace, and the rolling forecast structure that keeps you ahead.
Landscaping Pricing Guide: How to Price Your Work Profitably
A practical guide to landscaping pricing — covering hourly rates, per-square-foot benchmarks, overhead recovery, and the markup math that determines whether you're making money.