Real Estate Income Statement Example: NOI and What the Numbers Mean
A real estate income statement example with line items, OER benchmarks from IREM, and a worked example showing how NOI connects to property value.
A real estate income statement is built differently than a P&L for most other businesses. It doesn't end at net profit — it ends at net operating income (NOI). Understanding that distinction, and why it matters, is the starting point for reading and building one correctly.
The Structure: GPI → EGI → NOI
Real estate income statements follow a specific waterfall. Each line is a deliberate step down from theoretical maximum income to actual operating income.
Gross Potential Income (GPI)
GPI is the maximum rent the property could collect if every unit were occupied and every tenant paid in full. For a four-unit building with rents of $1,500/month per unit, GPI is $6,000/month ($72,000/year).
GPI is your ceiling. Everything below it represents friction — expected vacancies, non-payment, and operating costs.
Vacancy and Credit Loss Allowance
This line reduces GPI by an estimate of income that won't be collected. It covers:
- Units vacant between tenants (turnover time)
- Tenants who default or are evicted
- Months of reduced rent during lease-up
The U.S. Census Bureau reported a national rental vacancy rate of 6.8% in 2024. Most investors model 5–10% of GPI as their vacancy allowance, even for fully occupied properties — because occupancy won't be permanent, and lenders expect to see this line.
A 5% allowance is appropriate for well-located, stabilized properties in low-vacancy markets. Use 8–10% for higher-turnover properties, lease-up situations, or markets with softer rental demand.
Other Income
Non-rent revenue specific to the property:
- Pet fees and pet rent
- Parking fees
- Storage unit income
- Laundry income (coin-operated or in-unit)
- Late fees
- Utility reimbursements from tenants
Other income is added back after the vacancy deduction because it's typically more reliable than rent — parking is paid even if a unit is briefly vacant.
Effective Gross Income (EGI) = GPI − Vacancy Allowance + Other Income
EGI is the income figure your operating expenses are measured against.
Operating Expenses
This is where real estate income statements diverge most sharply from other industry P&Ls. Standard operating expense line items include:
- Property taxes — typically 1–2% of assessed value annually, varies significantly by state
- Property insurance — hazard insurance, liability, sometimes umbrella policy
- Property management fees — 8–12% of collected rent for residential (industry standard range per Baselane, Stessa, Belong Home)
- Repairs and maintenance — ongoing upkeep, minor fixes, appliance repairs
- Utilities — water, sewer, trash, electricity for common areas (tenant-billed utilities aren't included)
- Landscaping and snow removal
- Advertising and tenant screening — listing fees, background check costs
- Legal and accounting fees
- HOA dues (if applicable)
- Administrative costs — software, office supplies, mileage
Three items that are not operating expenses, and don't belong in NOI:
- Mortgage principal and interest — financing cost, not an operating cost
- Capital expenditures — roof replacement, HVAC, major renovations (these are below-the-line reserves)
- Depreciation — a tax deduction, not a cash operating expense
- Income taxes — depends on your ownership structure and other income
Excluding these items is what makes NOI comparable across properties. Two investors who financed the same property differently will have identical NOIs but very different mortgage payments. Lenders underwrite to NOI precisely because of this standardization. For the full accounting treatment of how these below-the-line items are recorded, the real estate accounting guide covers depreciation schedules, capital improvement classification, and Schedule E reporting.
Net Operating Income (NOI)
NOI = EGI − Operating Expenses
NOI tells you how much the property generates from operations before debt service and taxes. It's the central metric in commercial real estate, used for property valuation, lender underwriting, and investor comparison.
OER Benchmarks by Property Type
The operating expense ratio (OER) measures operating expenses as a percentage of gross income. Lower OER means more income flows through to NOI.
| Property Type | Typical OER |
|---|---|
| Conventional multifamily (national) | 41% (IREM 2023, 904,724 units) |
| Well-managed multifamily | 35–50% |
| Single-family rentals | 50–70% |
| Small multifamily (2–20 units) | 50–65% |
The IREM 2023 national data shows multifamily operating expenses averaging $8,420 per unit annually on gross rents of $20,421 per unit — an OER of 41%. That figure has remained relatively stable (42% in 2015) even as absolute costs rose 61% over that period, because rents increased in parallel.
Single-family rentals run significantly higher OERs than multifamily because you can't spread fixed costs like management, insurance, and maintenance across multiple units.
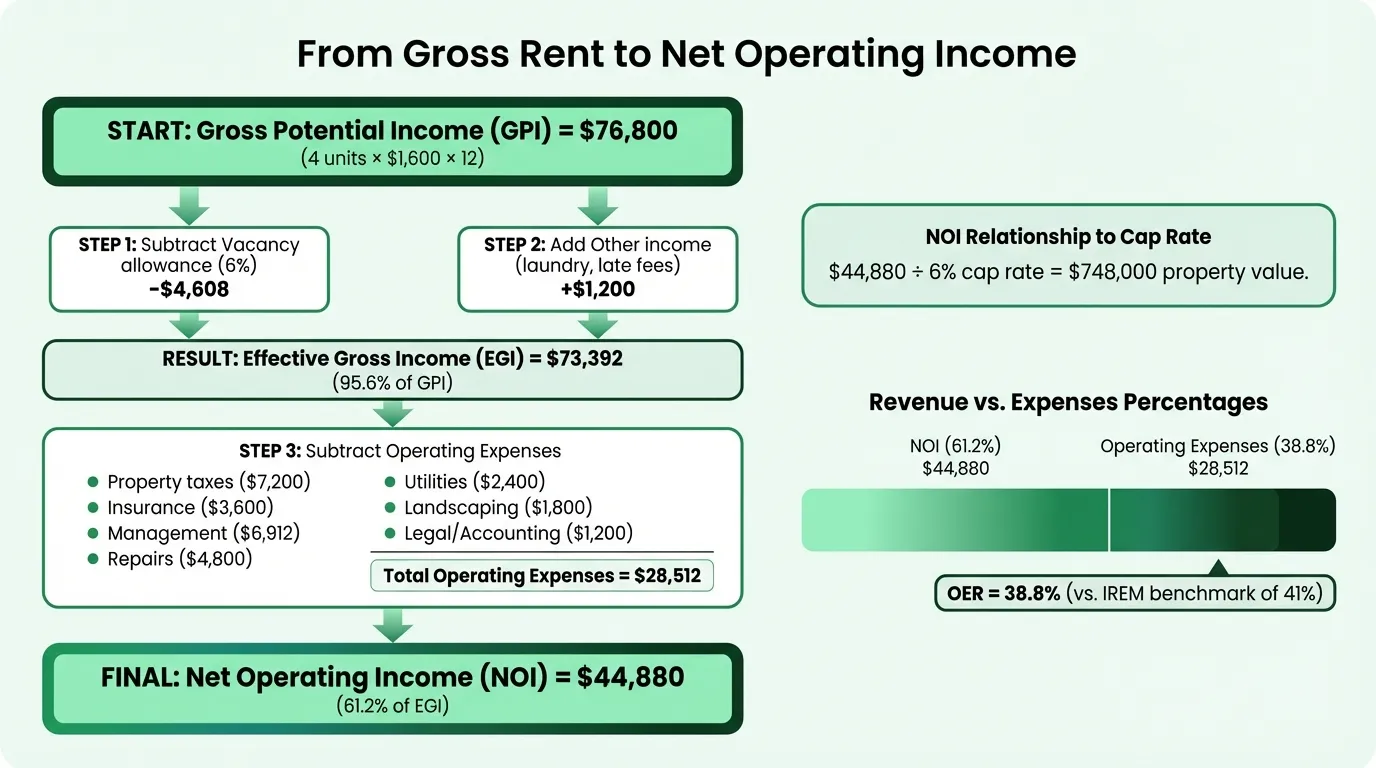
Worked Example: Four-Unit Residential Property
Here's a realistic annual income statement for a four-unit building generating $1,600/month per unit in a mid-tier market:
Income
| Line | Annual Amount | % of GPI |
|---|---|---|
| Gross Potential Income (4 units × $1,600 × 12) | $76,800 | 100% |
| Vacancy allowance (6%) | ($4,608) | (6.0%) |
| Other income (laundry, late fees) | $1,200 | 1.6% |
| Effective Gross Income | $73,392 | 95.6% |
Operating Expenses
| Line | Annual Amount | % of EGI |
|---|---|---|
| Property taxes | $7,200 | 9.8% |
| Property insurance | $3,600 | 4.9% |
| Property management (10% of collected rent) | $6,912 | 9.4% |
| Repairs and maintenance | $4,800 | 6.5% |
| Utilities (common area water/trash) | $2,400 | 3.3% |
| Landscaping | $1,800 | 2.5% |
| Advertising and tenant screening | $600 | 0.8% |
| Legal, accounting, administrative | $1,200 | 1.6% |
| Total Operating Expenses | $28,512 | 38.8% |
NOI
| Amount | % of EGI | |
|---|---|---|
| Net Operating Income | $44,880 | 61.2% |
This example shows an OER of 38.8% — slightly better than the IREM national average of 41%, achievable on a well-maintained property with stable tenants. The implied NOI margin is 61.2%.
Note what's missing: no mortgage payment, no CapEx, no depreciation. If the building carries a $450,000 mortgage at 7% interest, annual debt service is roughly $35,900. After debt service, cash flow is about $8,980. That's a separate calculation from NOI — and it's why investors evaluate properties on NOI before running their own financing assumptions.
Need a ready-made income statement template for your real estate?
Download a pre-built spreadsheet with industry-specific categories, formulas, and formatting.
How NOI Connects to Cap Rate and Property Value
Cap rate is the relationship between NOI and property value:
Cap Rate = NOI ÷ Market Value
Or rearranged for valuation: Market Value = NOI ÷ Cap Rate
At a 6% cap rate, the $44,880 NOI from the example above implies a property value of $748,000. Use the real estate profit margin calculator to quickly test how changes in rent or expenses affect your NOI margin.
This relationship makes every operating expense line meaningful beyond its immediate cash impact. If you reduce annual operating expenses by $5,000 on a property in a 6% cap rate market, you've increased the property's implied value by $83,333 — not just saved $5,000.
Lenders use NOI to calculate the Debt Service Coverage Ratio (DSCR):
DSCR = NOI ÷ Annual Debt Service
Most commercial and investor lenders require a minimum DSCR of 1.25–1.35. On the example property with $35,900 in debt service, the DSCR would be 1.25 ($44,880 ÷ $35,900) — right at the typical minimum threshold.
The Property Management Fee Question
Including an 8–12% property management fee is worth discussing because many self-managing landlords skip it.
The fee is a real economic cost even if you're not paying it. If you're spending 5 hours per month on management, that time has value. More practically, the income statement without a management fee will overstate NOI for any lender, buyer, or partner who will eventually see it.
Standard fees: 8–10% for residential single-family; 8–12% for small multifamily. Some managers also charge leasing fees (50–100% of one month's rent) and repair markups (10–25%). These can be captured as separate lines or folded into a management line item.
For the income statement to be lender-ready and comparable to other properties, include the fee even when self-managing.
Putting the Income Statement to Work
The income statement serves different purposes depending on where you are in the investment lifecycle:
Acquisition due diligence: Reconstruct the seller's NOI from scratch using actual rent rolls and verified expenses. Sellers often present "pro forma" income statements with optimistic vacancy assumptions and understated expenses. Get the trailing 12 months of bank statements and tax returns to verify.
Lender packages: Banks and commercial lenders require at least 2 years of actual operating history plus a current income statement. NOI and DSCR are the primary underwriting metrics. The Real Estate Income Statement Template is formatted for this purpose.
Portfolio monitoring: Run the income statement quarterly. OER creeping up is often the first signal that a property needs attention — maintenance costs rising faster than rents, or a management fee that's no longer competitive. The real estate balance sheet example shows how these operating results flow through to your asset and equity positions.
Disposition: Buyers will run their own NOI calculation. Having a clean, well-documented income statement with accurate vacancy history and itemized expenses speeds up buyer due diligence and supports your asking price.
If you're modeling a property before purchase, the Real Estate Financial Model Template extends the income statement with cap rate assumptions, financing structure, and multi-year projections. For ongoing budget tracking, the Real Estate Budget Template pairs with the income statement for budget-vs-actual comparisons.
What the Income Statement Doesn't Show
Two limitations worth noting:
Cash flow is different from NOI. A positive NOI property can have negative cash flow if the debt service exceeds NOI. Conversely, a high-leverage property can show strong cash flow in early years but accumulate deferred maintenance that appears as future operating expenses. The income statement shows operating performance; cash position requires a separate cash flow analysis.
CapEx is invisible in NOI. Major capital expenditures — roof replacement, HVAC systems, kitchen renovations — don't flow through the operating expense section. Many investors model a CapEx reserve of 5–10% of gross income below the NOI line to account for this. When comparing properties, ask whether the seller's NOI includes any CapEx reserve or whether the building has deferred maintenance that will create future capital costs.
A real estate income statement that ends at NOI is a snapshot of current operations. Understanding what sits above and below that number is what separates investors who buy based on listed NOI from those who underwrite it.
Last updated: March 24, 2026
Frequently Asked Questions
Related Articles
Coffee Shop Income Statement Example: Revenue, Costs, and Margins
A coffee shop income statement example with beverage cost benchmarks, labor targets, prime cost rules, and a worked P&L for an independent café doing $480K/year.
Daycare Income Statement Example: Revenue, Costs, and Margins
A daycare income statement example with tuition revenue, CACFP reimbursements, staff cost benchmarks, and a worked P&L for a 50-child childcare center.
Food Truck Income Statement Example: Line Items and Benchmarks
A food truck income statement example with food cost benchmarks, unique line items like commissary and pitch fees, and a worked P&L for a single-truck operation.
Healthcare Income Statement Example: Revenue, Expenses, and Margins
A healthcare income statement example covering net patient revenue, contractual adjustments, expense benchmarks, and operating margin targets for providers.
Healthcare Pro Forma Example: What to Include and How to Build One
A practical healthcare pro forma example — covering revenue projections, payer mix, expense benchmarks, and a worked model for a new medical practice or service line.
Hotel Pro Forma Example: What to Include and How to Build One
A practical hotel pro forma example — covering RevPAR, GOP, undistributed expenses, FF&E reserves, and a worked model for acquisition or development underwriting.