Real Estate Financial Model Example: What's In It and How It Works
A practical real estate financial model example covering NOI, cap rates, IRR benchmarks, debt service, and common mistakes that distort the analysis.
A real estate financial model has one job: tell you whether a deal is worth doing at the price you're considering — and what returns you can realistically expect.
The mechanics are straightforward. You project the property's income and expenses to get net operating income, layer in debt service, calculate returns over the hold period, and run scenarios to understand what happens if things go wrong. The analysis only gets complicated when the inputs are wrong or the model is built sloppily.
This post walks through a real example with the components that matter and the benchmarks that give the numbers context.
The Building Blocks
Every real estate financial model starts with the same four layers:
1. Revenue
Revenue modeling begins with Gross Potential Rent (GPR) — the maximum income if every unit were occupied at market rate. From there, you subtract vacancy and credit loss (the percentage you expect from turnover and non-payment) to get Effective Gross Income.
Most stabilized multifamily assets model vacancy at 5–7%. Class B and C assets in secondary markets often model 8–10%. If you're modeling a lease-up scenario, vacancy starts high (30–50%) and steps down to stabilized rates over 12–24 months.
Below EGI, add other income: parking fees, laundry, storage, pet fees, and any ancillary revenue. On a 100-unit multifamily property, other income can add $30,000–$60,000 per year to the top line.
2. Operating Expenses
Standard operating expenses for a commercial or multifamily property:
- Property management fee (typically 4–6% of collected revenue)
- Property taxes
- Insurance
- Utilities (if owner-paid)
- Maintenance and repairs
- CapEx reserve (commonly $250–$500/unit/year for multifamily)
- Leasing commissions and tenant improvement allowances (for commercial leases)
- Administrative costs
One mistake many first-time modelers make: accepting the seller's operating expense figures. Sellers have incentive to minimize reported expenses. Insurance costs and payroll in particular often come in higher than shown on the offering memorandum. Build your own expense assumptions from comparable properties and local cost data. The real estate income statement example shows OER benchmarks by property type to cross-check your assumptions.
3. Net Operating Income
NOI = Effective Gross Income − Operating Expenses
NOI excludes debt service, depreciation, and income taxes. It represents what the property earns independent of how it's financed — which is why cap rates and valuations are based on NOI rather than cash flow after debt.
4. Debt Service
The model then layers in financing:
- Loan amount (based on LTV): conventional commercial mortgages typically require 65–75% LTV; Fannie Mae multifamily goes up to 75–80%
- Interest rate and amortization period
- Annual debt service (principal + interest)
- DSCR check: NOI / annual debt service. Lenders require a minimum of 1.20x–1.25x for most commercial properties, meaning NOI must be at least 20–25% above the debt payment
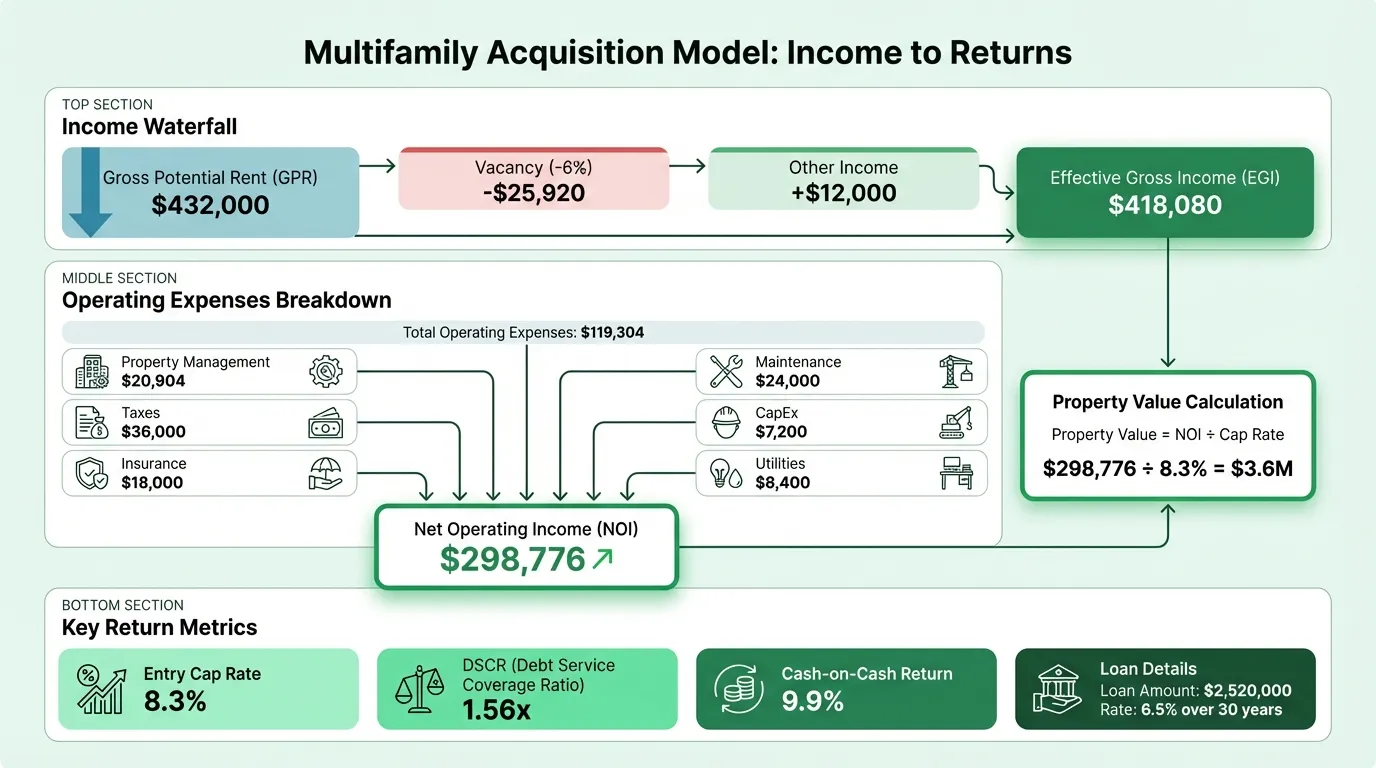
Worked Example: 24-Unit Multifamily Acquisition
Here's a simplified acquisition model for a 24-unit apartment building:
Property Assumptions
| Item | Amount |
|---|---|
| Purchase Price | $3,600,000 |
| Gross Potential Rent (GPR) | $432,000/year |
| Vacancy (6%) | ($25,920) |
| Other Income | $12,000 |
| Effective Gross Income | $418,080 |
Operating Expenses
| Expense | Annual |
|---|---|
| Property Management (5%) | $20,904 |
| Property Taxes | $36,000 |
| Insurance | $18,000 |
| Maintenance & Repairs | $24,000 |
| CapEx Reserve ($300/unit) | $7,200 |
| Utilities (common areas) | $8,400 |
| Administrative | $4,800 |
| Total OpEx | $119,304 |
NOI and Returns
| Metric | Amount |
|---|---|
| Net Operating Income | $298,776 |
| Entry Cap Rate | 8.3% |
| Loan (70% LTV) | $2,520,000 |
| Annual Debt Service (6.5%, 30yr amort) | $191,232 |
| DSCR | 1.56x |
| Pre-Tax Cash Flow | $107,544 |
| Cash-on-Cash Return | 9.9% |
This deal produces a 9.9% cash-on-cash return on the $1,080,000 equity invested — solidly in the "good" range for most markets. The DSCR at 1.56x exceeds the typical lender minimum, providing buffer if occupancy drops.
The IRR calculation would factor in rent growth assumptions, CapEx spend over the hold period, and a terminal value based on an exit cap rate (typically 25–50 basis points above entry to reflect asset aging and market risk). For a step-by-step acquisition underwriting walkthrough, the real estate pro forma example builds out a 10-unit deal with full return calculations.
Return Metrics and What They Mean
Real estate models produce multiple return metrics for good reason — each one tells you something different:
| Metric | What It Measures | Limitation |
|---|---|---|
| Cap Rate | Property yield at purchase price | Ignores financing and time value of money |
| Cash-on-Cash | Annual yield on equity invested | Only covers current year, not full investment horizon |
| IRR | Time-weighted return over full hold period | Assumes reinvestment at IRR rate; sensitive to exit timing |
| Equity Multiple | Total return per dollar invested | Doesn't account for how long money is deployed |
Cap rate benchmarks (CBRE, 2025):
| Property Type | Typical Range |
|---|---|
| Multifamily Class A | 4.7%–5.0% |
| Multifamily Class B | 4.9%–5.4% |
| Industrial (Sun Belt) | 4.5%–5.5% |
| Retail (net lease, credit tenant) | 4.8%–6.0% |
| Office | 5.5%–9.3% |
IRR targets by strategy:
| Strategy | IRR Target | Risk Profile |
|---|---|---|
| Core | 5%–9% | Stabilized assets, credit tenants |
| Core-Plus | 8%–10% | Modest upside levers, low-moderate risk |
| Value-Add | 11%–20% | Renovation, lease-up, repositioning |
| Opportunistic | 20%+ | Ground-up development, distressed |
Cash-on-cash benchmarks: 5–7% is acceptable in high-demand markets; 8–12% is considered solid; above 12% typically signals higher risk or an emerging market.
Need a ready-made financial model template for your real estate?
Download a pre-built spreadsheet with industry-specific categories, formulas, and formatting.
Types of Real Estate Financial Models
The model structure varies depending on the deal type:
Acquisition Model Used to evaluate purchasing an existing, stabilized property. The purchase price is derived by applying a market cap rate to in-place NOI. Debt and equity fund upfront. The model projects cash flows over a 5–10 year hold and models an exit at a terminal cap rate. The core question: does this deal clear the return hurdle?
Development Model (Ground-Up) Significantly more complex. Land, hard costs, and soft costs replace a purchase price. Debt and equity are drawn down in phases over the construction period. There's no revenue during construction. Returns are measured from the first dollar in to the last dollar distributed — often 3–7 years later. IRR hurdles are higher to compensate for entitlement, construction, and lease-up risk.
Value-Add Model A hybrid: acquire an existing property, spend on improvements, increase NOI, and sell at a lower cap rate (higher valuation). The model needs to account for acquisition cost, renovation/CapEx budget, a transitional period with disrupted income, and the improved cash flows post-renovation. Underwriting the renovation costs and timing is where most value-add deals get into trouble.
Rental Property / Cash Flow Model Used for ongoing portfolio management and refinancing analysis. Focus is on the rent roll — tracking individual leases, renewal probabilities, rent bumps, and occupancy over time. Less about investment returns, more about understanding what the property earns and when leases expire.
The Real Estate Financial Model Template is built around the acquisition and value-add use cases — the most common starting point for investors evaluating deals.
Common Modeling Mistakes
Aggressive exit cap rate. The most common error that turns bad deals into apparent good deals. Many models assume you'll sell at the same cap rate you bought — or lower. In practice, older assets in a higher-rate environment often transact at higher cap rates. Adding even 50 basis points to your exit cap rate can flip a deal from 15% IRR to marginal. Model a range.
No stress test. A single-scenario base case isn't analysis — it's a pitch deck. Build a downside case with higher vacancy, flat rent growth, and a 75bps higher exit cap rate. If the deal still works in the downside case, you have conviction. If it only works in the upside, you're speculating. Use the real estate break-even calculator to find the minimum occupancy threshold where the deal still covers debt service.
Ignoring property tax reassessment. In many jurisdictions, a sale triggers reassessment to the purchase price. If you're buying a property that was last assessed at $1.8M and you're paying $3.6M, your year-one tax bill could double from what the current owner shows. Model year-one taxes based on your purchase price, not the seller's current bill.
Accepting broker proforma income figures. A broker's offering memorandum shows rent potential and often understates vacancy, maintenance, and management costs. Underwrite using your own market rent research and expense assumptions from comparable properties.
Circular references in debt/waterfall calculations. This is a mechanics problem, not a judgment problem — but it produces unreliable outputs. If your model needs to calculate debt draws based on costs that depend on financing, or waterfall distributions that reference each other, build the structure carefully. Errors here are hard to spot and easy to miss.
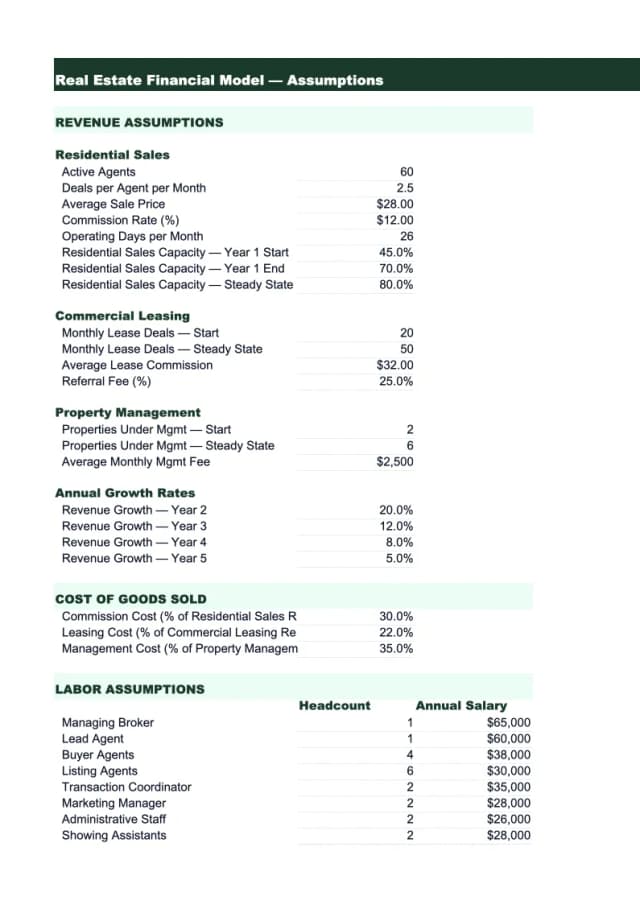
Building the Model
For most acquisition analyses, a well-structured Excel model covers:
- Assumptions tab — all inputs in one place (purchase price, rent, vacancy, expenses, loan terms, hold period, exit cap rate)
- Pro forma tab — annual projections of income, expenses, NOI, and cash flow over the hold period
- Returns tab — cap rate, cash-on-cash, IRR, and equity multiple calculations
- Sensitivity analysis — IRR and CoC returns across a matrix of exit cap rates and rent growth scenarios
- Debt schedule — amortization table with DSCR check
For deals with equity partners or fund structures, add a waterfall tab showing LP/GP distributions at different return hurdles.
The Real Estate Financial Model Template includes all five components. If you're also looking at the property's ongoing income performance, the Real Estate Income Statement Template and Real Estate Cash Flow Template handle the operational reporting side.
The financial model tells you whether to buy. The income statement and cash flow reports tell you how the asset is performing once you own it. Turn your model into a presentation-ready deck with Deckary.
Last updated: March 23, 2026
Frequently Asked Questions
Related Articles
Coffee Shop Income Statement Example: Revenue, Costs, and Margins
A coffee shop income statement example with beverage cost benchmarks, labor targets, prime cost rules, and a worked P&L for an independent café doing $480K/year.
Daycare Income Statement Example: Revenue, Costs, and Margins
A daycare income statement example with tuition revenue, CACFP reimbursements, staff cost benchmarks, and a worked P&L for a 50-child childcare center.
Food Truck Income Statement Example: Line Items and Benchmarks
A food truck income statement example with food cost benchmarks, unique line items like commissary and pitch fees, and a worked P&L for a single-truck operation.
Healthcare Income Statement Example: Revenue, Expenses, and Margins
A healthcare income statement example covering net patient revenue, contractual adjustments, expense benchmarks, and operating margin targets for providers.
Healthcare Pro Forma Example: What to Include and How to Build One
A practical healthcare pro forma example — covering revenue projections, payer mix, expense benchmarks, and a worked model for a new medical practice or service line.
Hotel Pro Forma Example: What to Include and How to Build One
A practical hotel pro forma example — covering RevPAR, GOP, undistributed expenses, FF&E reserves, and a worked model for acquisition or development underwriting.