Real Estate Financial Model Template
Project your GCI, model commission income by deal source, and track the full P&L of your real estate business — built for agents, team leads, and small brokerages.
What's Inside This Real Estate Financial Model Template
This template includes 7 worksheets, each designed for a specific part of your real estate financial workflow:
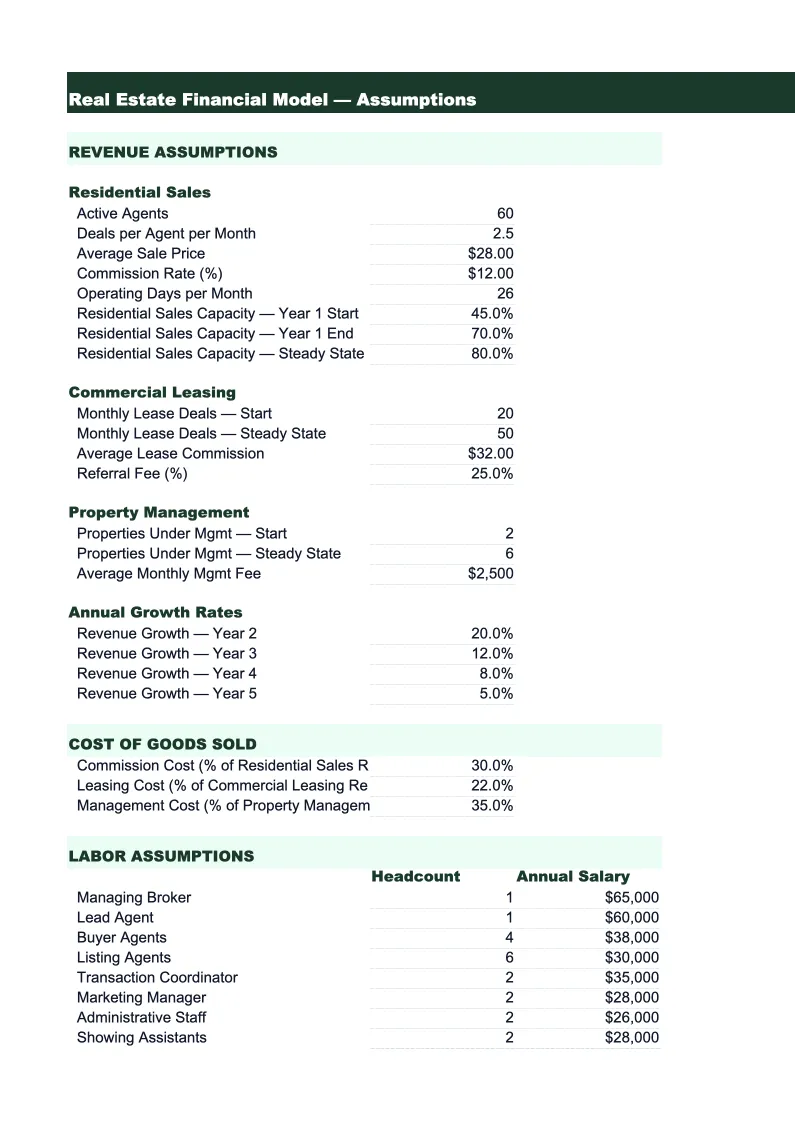
Assumptions
The central input sheet for the entire model.
Transaction Model
A month-by-month projection of closed transactions broken down by source and type.
GCI & Commission
A detailed gross commission income (GCI) analysis that shows how each deal flows through the split structure to your net commission.
Expense Budget
A month-by-month expense plan with categories specific to real estate professionals.
P&L
A 12-month income statement that pulls net commission income from the GCI & Commission sheet and total expenses from the Expense Budget.
Cash Flow
A monthly cash flow statement designed around the reality of real estate income: commissions arrive in lumps at closing, not in even monthly installments.
Dashboard
A one-page summary showing the metrics that matter most for a real estate business: projected annual GCI, number of closed transactions, average commission per deal, net income after expenses, and net margin.
Real Estate Financial Model Template Features
- GCI projection by deal type: buyer-side, seller-side, dual agency, and referral income
- Brokerage split and referral fee calculations that flow to net commission
- Real estate expense categories: MLS dues, E&O, marketing, technology, and transaction costs
- Seasonal closing curve built in — adjustable by market
- Cash flow model that accounts for commission timing, not just monthly averages
- Net margin and expense ratio benchmarks calculated automatically
How to Use This Real Estate Financial Model Spreadsheet
Start with the Assumptions sheet and fill in your current business numbers: your average home sale price in your market, the commission rates you typically charge on buyer and seller sides, your brokerage split, and the number of transactions you closed last year by month. Don't worry about making it perfect — rough numbers get you 90% of the value, and you can refine inputs as the year progresses. The Transaction Model sheet will immediately show you a monthly projection of GCI based on those inputs, and you can adjust individual months where you know your pipeline looks different.
Once the baseline looks right, work through the Expense Budget sheet. Most of the line items are pre-loaded with common real estate expenses — review the categories and enter your actual or planned costs for each. Pay particular attention to your marketing budget, since that's typically the largest variable expense and the one with the most leverage. The P&L sheet updates automatically as you fill in expenses, showing your projected net income and key ratios. If your net margin looks too thin, the P&L makes it easy to see which expense categories are the biggest contributors and where you have room to cut.
15 minutes from download to your first real estate forecast
Download the template, enter your transaction volume and commission rates, and see your full business picture — GCI, expenses, cash flow, and net income — for the next 12 months.
Why Every Real Estate Agent Needs a Financial Model
Most real estate agents run their business on feel: they know roughly what they made last year, they know they need more listings, and they reinvest in marketing when it feels right. That approach works until it doesn't — until a slow quarter creates a cash crunch, until a big marketing investment doesn't generate the expected pipeline, or until tax season reveals a net income that doesn't match the volume they thought they were doing. A financial model forces the numbers into the open, where you can actually manage them.
The key metric for any real estate agent is GCI — gross commission income — but GCI alone doesn't tell you if the business is healthy. An agent doing $300,000 in GCI with $220,000 in expenses and a high team split may take home less than an agent doing $180,000 in GCI with tight overhead. The expense ratio (total expenses divided by GCI) is what separates agents building wealth from agents running expensive operations. Productive solo agents typically run expense ratios between 20% and 30%. Teams with buyer agents run higher, often 40–55%, because agent compensation is a direct cost. Knowing which structure you're operating under, and what ratio you're hitting, is the foundation of a real estate business plan.
Real Estate Industry at a Glance
Financial templates built for real estate professionals — agents, brokers, property managers, appraisers, and inspectors. Pre-loaded with commission tracking, management fee structures, and transaction-based billing.
Revenue Drivers
- Sales commissions
- Property management fees
- Lease-up / tenant placement fees
- Appraisal & inspection fees
Key Cost Categories
- MLS & licensing fees
- Marketing & advertising
- E&O insurance
- Transaction coordination
- Technology & CRM
- Office & brokerage fees
Typical Margins
Gross: 40-70% · Net: 15-35%
Seasonality
Peak activity spring through summer (March–August); winter slowdown, especially December–January. Commercial real estate has less pronounced seasonality.
Key Performance Indicators
Real Estate Financial Model Template FAQ
More Real Estate Templates
Real Estate Balance Sheet Template for Excel
$29
Real Estate Budget Template for Excel
$29
Real Estate Business Plan Template for Excel
$39
Real Estate Cash Flow Template for Excel
$29
Real Estate Expense Tracker Template for Excel
$29
Real Estate Income Statement Template for Excel
$29
Real Estate Invoice Template for Excel
$29
Real Estate KPI Dashboard Template for Excel
$29
Real Estate P&L Template for Excel
$29
Real Estate Pro Forma Template for Excel
$29
Real Estate Project Budget Template for Excel
$29
Real Estate Sales Forecast Template for Excel
$29
Real Estate Business Valuation Template for Excel
$29
More Financial Model Templates
Real Estate Financial Model Template
$29