Retail KPI Examples: The Metrics That Actually Matter
A practical guide to retail KPIs — covering sales, inventory, customer, and financial metrics with real benchmarks so you know what good looks like.
Most retail businesses measure revenue and gross profit. That's a start, but it leaves a lot of expensive blind spots — overstocked shelves, flagging conversion rates, or shrinkage eating into margins without anyone noticing.
Good retail KPIs tell you not just what happened, but why, and what to do about it. Here's a practical guide to the metrics that matter, with real benchmarks so you can tell whether your numbers are strong or whether they're quietly costing you money.
Sales KPIs
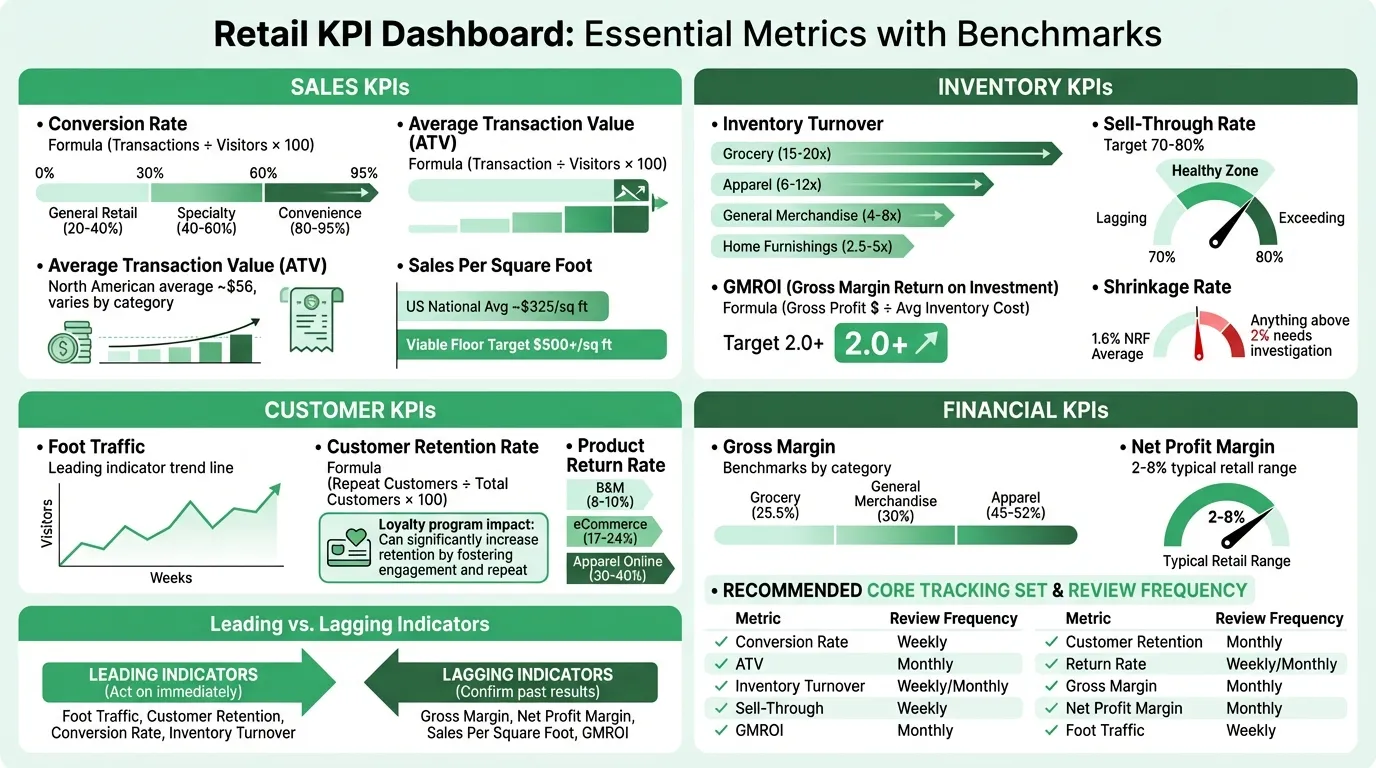
Conversion Rate
Conversion rate is the percentage of store visitors (or website sessions) who make a purchase. It's one of the most direct measures of whether your merchandising, staff, and store experience are doing their job.
Formula: Transactions ÷ Total Visitors × 100
Benchmarks:
- General retail: 20–40%
- High-traffic mall stores: 15–20%
- Specialty / destination stores: 40–60%
- Convenience stores: 80–95%
A dip in conversion rate while foot traffic holds steady tells you something changed inside the store — pricing, product mix, staff performance, or store layout. That's more useful than just seeing flat or declining revenue.
Average Transaction Value (ATV)
ATV measures how much a customer spends per visit. Increasing ATV by 10% has the same revenue impact as increasing foot traffic by 10% — but typically costs less to achieve.
Formula: Total Revenue ÷ Number of Transactions
Benchmark: The North American retail average is roughly $56 per transaction, but this varies enormously by category. Jewelry runs over $100; big-ticket home goods can exceed $300. Track your own ATV over time and compare to your category, not retail broadly.
Tactics that move ATV: upselling, cross-selling, bundling, and minimum-spend promotions. A loyalty program that rewards larger baskets also tends to lift ATV. Getting the markup and margin math right is the prerequisite — bundling only lifts ATV if the bundle itself is priced profitably.
Sales Per Square Foot
For brick-and-mortar retailers, sales per square foot is the fundamental measure of how well you're using your space.
Formula: Net Sales ÷ Total Selling Area (sq ft)
Benchmarks:
- U.S. national retail average: approximately $325/sq ft annually
- Viable retail floor often cited as needing $500+/sq ft
- Costco: ~$1,638/sq ft
- Walmart: ~$400–$574/sq ft
- Target: ~$300/sq ft
Low sales per square foot can mean you have too much space, you're underutilizing it, or you're carrying slow-moving categories that take up floor room without turning.
Inventory KPIs
Inventory Turnover
Inventory turnover tells you how many times your full inventory sells and is replaced within a year. Low turnover means capital tied up in slow-moving stock; excessively high turnover can mean stockouts and lost sales.
Formula: Cost of Goods Sold ÷ Average Inventory
Benchmarks by category:
| Category | Typical Turns |
|---|---|
| Grocery / perishables | 15–20x+ |
| Fashion / apparel | 6–12x |
| General merchandise | 4–8x |
| Home furnishings | 2.5–5x |
The broader retail sector averaged 13.79x in Q1 2024 according to CSIMarket — but that number is pulled up by high-turnover grocery. Compare yours against your specific category.
Sell-Through Rate
Sell-through rate measures what percentage of your received inventory actually sold during a period. It's especially important for seasonal, fashion, or trend-driven categories where unsold inventory loses value quickly.
Formula: Units Sold ÷ Units Received × 100
Benchmarks:
- Healthy range for most retailers: 70–80%
- Strong performance: 80%+
- Warning sign: below 50%
- Fashion entering markdown season: target 60–70%
Tracking sell-through rate by SKU and category — not just overall — shows you which products are working and which are tying up your open-to-buy budget.
GMROI (Gross Margin Return on Investment)
GMROI combines margin and turnover into a single number. A product can have high gross margin but slow turnover (bad), or lower margin but fast turnover (can still be good). GMROI captures both.
Formula: Gross Profit Dollars ÷ Average Inventory Cost
A GMROI above 1.0 means you're at least recovering your inventory investment. Most retailers target 2.0 or higher. A GMROI of 2.5 means you're generating $2.50 in gross profit for every $1.00 in inventory.
Use GMROI to make buying decisions. If two product categories have similar gross margins but Category A turns twice as fast, Category A's GMROI is roughly double — and deserves more floor space and open-to-buy dollars.
Shrinkage Rate
Shrinkage covers inventory losses from shoplifting, employee theft, vendor fraud, and administrative error. According to the NRF's 2023 National Retail Security Survey, the average retail shrink rate was 1.6% of retail sales — representing $112.1 billion in losses across the industry.
Formula: (Inventory on Hand – Recorded Inventory) ÷ Total Sales × 100
A shrinkage rate above 2% warrants investigation. Retailers in high-theft categories (pharmacy, consumer electronics, beauty) typically implement additional controls. Regular cycle counts — counting a portion of inventory continuously rather than once-yearly — catch shrinkage before it compounds.
Customer KPIs
Foot Traffic
Foot traffic is the leading indicator that predicts future sales. It doesn't tell you whether those visitors bought anything (that's conversion rate), but a declining foot traffic trend is the first signal that marketing, location, or external factors are shifting your customer base.
Track foot traffic by day of week, time of day, and month to understand patterns. Spikes from promotions or external events are visible in the data. A store with improving conversion but declining foot traffic has a different problem than one with falling conversion at steady traffic.
Customer Retention Rate
Acquiring a new customer costs more than retaining an existing one. Retention rate measures how many customers who bought previously return within a defined period.
Formula: ((Customers at End of Period – New Customers) ÷ Customers at Start of Period) × 100
High retention is worth money. Loyal customers typically have higher ATV, lower return rates, and generate word-of-mouth referrals that reduce acquisition costs. Loyalty programs, personalized communications, and post-purchase follow-up all move this number.
Product Return Rate
Return rate measures the percentage of sold items that come back. High return rates eat gross margin in two ways: direct reverse logistics costs, and returned inventory that often can't be resold at full price.
Benchmarks:
- Brick-and-mortar: ~8–10%
- eCommerce overall: ~17–24%
- Apparel / footwear online: 30–40%
- Blended (all channels): ~16.9% in 2024 (Capital One Shopping Research)
A sudden spike in returns from a specific product or category usually points to a product quality issue, inaccurate descriptions, or sizing inconsistency — fixable problems if you're watching the data.
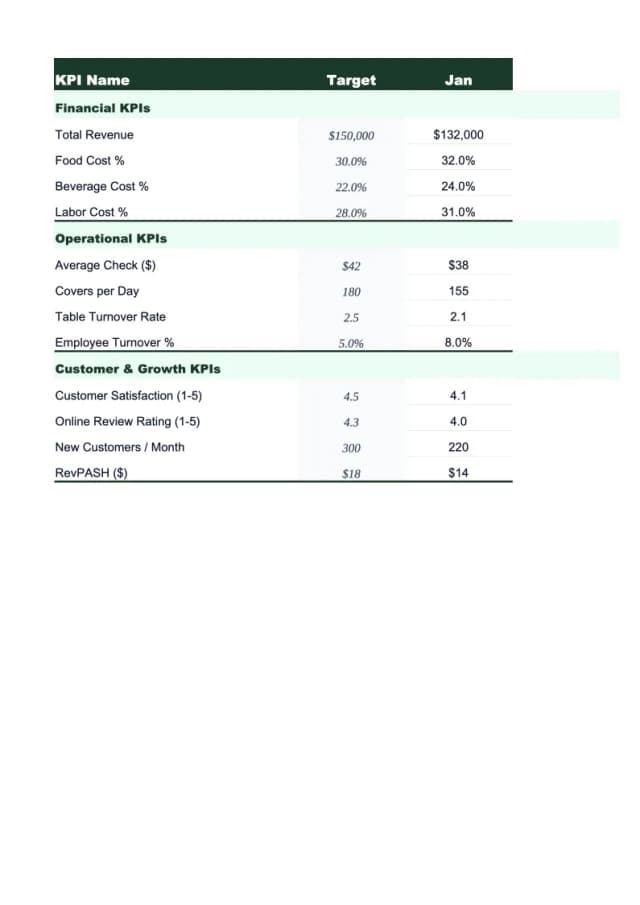
Need a ready-made kpi dashboard template for your retail?
Download a pre-built spreadsheet with industry-specific categories, formulas, and formatting.
Financial KPIs
Gross Margin
Gross margin is the percentage of revenue remaining after subtracting the cost of goods sold. It's the first line of defense for profitability — if gross margin is too thin, no amount of operational efficiency will rescue the business.
Formula: (Revenue – COGS) ÷ Revenue × 100
Benchmarks by category (NYU Stern, January 2024):
| Category | Average Gross Margin |
|---|---|
| Apparel / fashion | ~45–52% |
| Home furnishings | ~35–45% |
| General merchandise | ~30% |
| Grocery | ~25.5% |
| Consumer electronics | ~15–25% |
Gross margin can be improved by negotiating lower cost prices, reducing markdown depth, shifting mix toward higher-margin categories, or raising prices on inelastic items. Plug your category numbers into our retail profit margin calculator to see exactly where the gap is.
Net Profit Margin
Net margin measures what's left after COGS, operating expenses, interest, and taxes. It's the bottom-line efficiency metric — how much of each revenue dollar becomes profit.
Most retail businesses operate at net margins of 2–8%. Discount retailers with high volume run thin (1–3%); specialty retailers can reach 8–15%. The NRF's annual State of Retail report and Deloitte's Global Powers of Retailing provide industry-level net margin data for reference.
Leading vs. Lagging Indicators
The KPIs above fall into two types, and tracking both matters:
Lagging indicators confirm what already happened: annual revenue, gross margin, inventory turnover for a closed quarter. They're accurate but backward-looking. You can't change them.
Leading indicators predict future outcomes and can be acted on now: foot traffic trends, conversion rate by day of week, sell-through rate mid-season, customer satisfaction scores.
A retailer watching only lagging indicators discovers problems after they've already cost money. Watching leading indicators gives you time to respond — adjust staffing for a traffic dip, run a promotion to clear slow-moving inventory before it ages further, or investigate a conversion drop before it compounds for a full month.
How Many KPIs to Track
Most retail operators find that 8–12 metrics, reviewed consistently, are more useful than 30 metrics reviewed sporadically.
A practical starting set:
- Gross margin %
- Inventory turnover
- Sell-through rate
- Conversion rate
- Average transaction value
- Sales per square foot (if brick-and-mortar)
- Foot traffic
- Return rate
- Shrinkage rate
- Net profit margin
Track these weekly or monthly, compare against your historical baseline, and add context when a number moves. The goal isn't to have a dashboard full of numbers — it's to catch problems early and confirm what's working.
The Retail KPI Dashboard Template includes all of these metrics in a pre-built Excel format with summary views, trend charts, and benchmark comparison columns. If you're also tracking financial statements alongside operations, the retail income statement template and retail balance sheet template complement the KPI view with full period financials.
What to Do With the Data
KPIs are only useful if they're reviewed regularly and connected to decisions.
Build a simple review routine: look at your 8–10 core metrics at the same time each week or month. When a number moves — up or down — ask why before assuming. A conversion rate drop in January might just be post-holiday traffic patterns, not a store problem. A gross margin drop might reflect a cost increase that needs a price adjustment, not an efficiency failure.
The retailers who use KPIs well aren't running more complex analysis than the ones who don't. They're just reviewing the same core metrics consistently and acting on what they see. For retailers with commission-based sales associates, comp plan performance is another KPI worth tracking — Carvd handles the calculations.
Last updated: March 25, 2026
Frequently Asked Questions
Related Articles
Auto Repair Pricing Guide: How to Price Your Shop Profitably
How auto repair shop owners should price labor and parts — covering labor rate calculation, flat-rate hours, parts markup matrices, diagnostic fees, and the metrics that matter.
Cleaning Service Pricing Guide: How to Price Your Business Profitably
A practical guide to cleaning service pricing — covering hourly vs. flat rate vs. per square foot models, price benchmarks by service type, labor cost math, and the common mistakes that keep cleaning businesses from hitting their margin targets.
Construction Pricing Guide: How to Price Your Work Profitably
How contractors should price construction work — covering labor burden, overhead recovery, material markup, pricing methods, and the mistakes that quietly erode margin.
Electrical Pricing Guide: How to Price Your Work Profitably
How electricians and electrical contractors should price their work — covering hourly rates, flat-rate pricing, overhead recovery, material markup, and common mistakes that erode margin.
Hotel Sales Forecast: A Practical Example and Guide
How to build a hotel sales forecast — covering rooms, F&B, events revenue, key metrics like RevPAR and ADR, booking pace, and the rolling forecast structure that keeps you ahead.
Landscaping Pricing Guide: How to Price Your Work Profitably
A practical guide to landscaping pricing — covering hourly rates, per-square-foot benchmarks, overhead recovery, and the markup math that determines whether you're making money.