Retail Balance Sheet Example: A Line-by-Line Breakdown
A complete retail balance sheet example with real line items, industry benchmarks, and what makes retail different from every other industry.
Your income statement tells you whether you made money last month. Your balance sheet tells you whether the business is actually healthy.
Most retail owners watch sales and gross margin closely but treat the balance sheet as something their accountant handles at tax time. That's a gap. The balance sheet is where you see whether your inventory is getting too heavy, whether you're falling behind on vendor payments, and whether the equity in your business is actually growing over time.
This post walks through a complete retail balance sheet example — line by line — with the industry context that makes those numbers meaningful.
What Makes Retail Different on a Balance Sheet
Every balance sheet has the same three sections: assets, liabilities, and equity. The equation is always Assets = Liabilities + Equity. But the specific line items and the relative weight of each category look different in retail than in most other industries.
Inventory dominates current assets. For most retailers, merchandise inventory is the single largest asset on the balance sheet — often 60–80% of current assets. This is the defining characteristic of a retail balance sheet. It means your liquidity ratios will look different from industry averages in other sectors, and it means that your inventory management decisions show up directly in your financial position.
Accounts payable is strategically large. Retailers purchase goods on credit from suppliers, so accounts payable tends to be a major liability. Large retailers use extended payment terms (60–90 days) as an interest-free financing mechanism. Small retailers typically have shorter terms, but payables-to-inventory is still a key relationship to watch.
Leases dominate long-term liabilities. Most retailers lease their store space. Under ASC 842 (effective for private companies from December 2022), those operating leases now appear on the balance sheet as both an asset (Right-of-Use asset) and a liability. For a retailer with a long-term store lease, this can be the largest set of numbers on the entire balance sheet.
Gift card liability is real. When a customer buys a gift card, you collect cash but haven't yet delivered merchandise. That creates a current liability that persists until the card is redeemed.
The Three Sections: What Goes Where
Assets
Current assets — convertible to cash within 12 months:
- Cash and cash equivalents — your operating accounts and any short-term savings
- Accounts receivable — minimal for most consumer-facing retailers (customers pay at point of sale), but present for retailers with wholesale or corporate accounts
- Merchandise inventory — the goods you have on hand to sell. The largest current asset for almost every retailer
- Prepaid expenses — insurance premiums paid in advance, store deposits, prepaid rent
Long-term assets — owned assets that won't convert to cash within 12 months:
- Store fixtures and display equipment — shelving, display cases, signage, lighting
- Point-of-sale systems and technology — POS hardware, inventory management systems
- Leasehold improvements — build-out costs for a rented space, depreciated over the shorter of useful life or remaining lease term
- Right-of-use asset — the capitalized value of your operating lease, required under ASC 842 for leases longer than 12 months
Liabilities
Current liabilities — due within 12 months:
- Accounts payable — outstanding invoices to merchandise suppliers and vendors
- Accrued wages — payroll earned but not yet paid
- Gift card liability — sold but unredeemed gift cards, held as deferred revenue
- Sales tax payable — collected from customers, not yet remitted to the state
- Current portion of any equipment loans — principal due in the next 12 months
- Current portion of operating lease — lease payments due in the next 12 months
Long-term liabilities:
- Equipment loans (long-term portion) — remaining principal beyond 12 months
- Operating lease liability — the non-current portion of your lease obligation under ASC 842
Equity
For a sole proprietorship: owner's investment plus retained earnings.
For a corporation: common stock, additional paid-in capital, and retained earnings.
Retained earnings accumulate when you're profitable and don't withdraw all profits from the business. In retail — where net margins typically run 2–4% — retained earnings grow slowly. That's why it takes years to build meaningful equity in a retail operation.
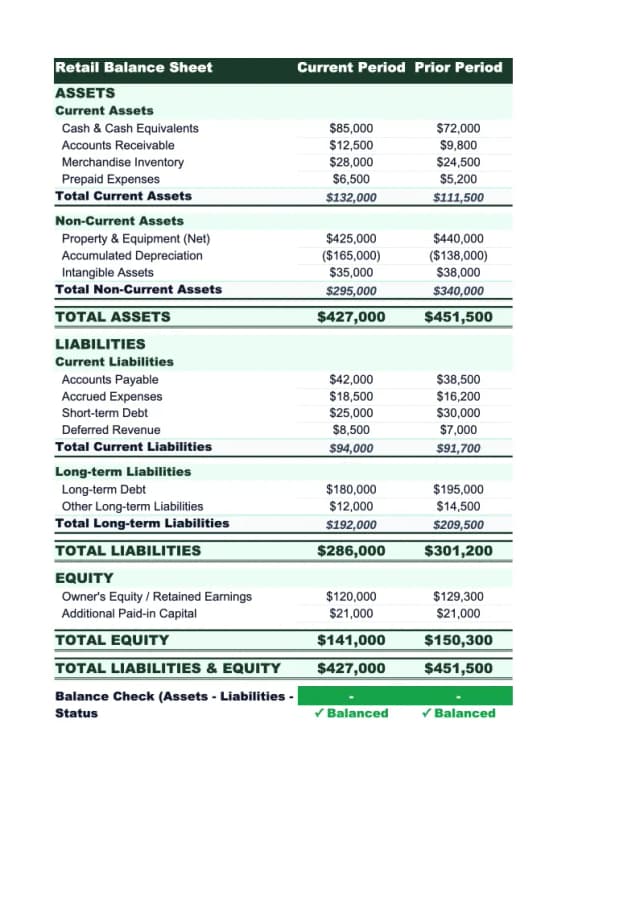
Complete Example: Independent Retail Store
Here's a representative balance sheet for an independent specialty retailer doing approximately $900,000 in annual sales:
Assets
Current Assets
| Line Item | Amount |
|---|---|
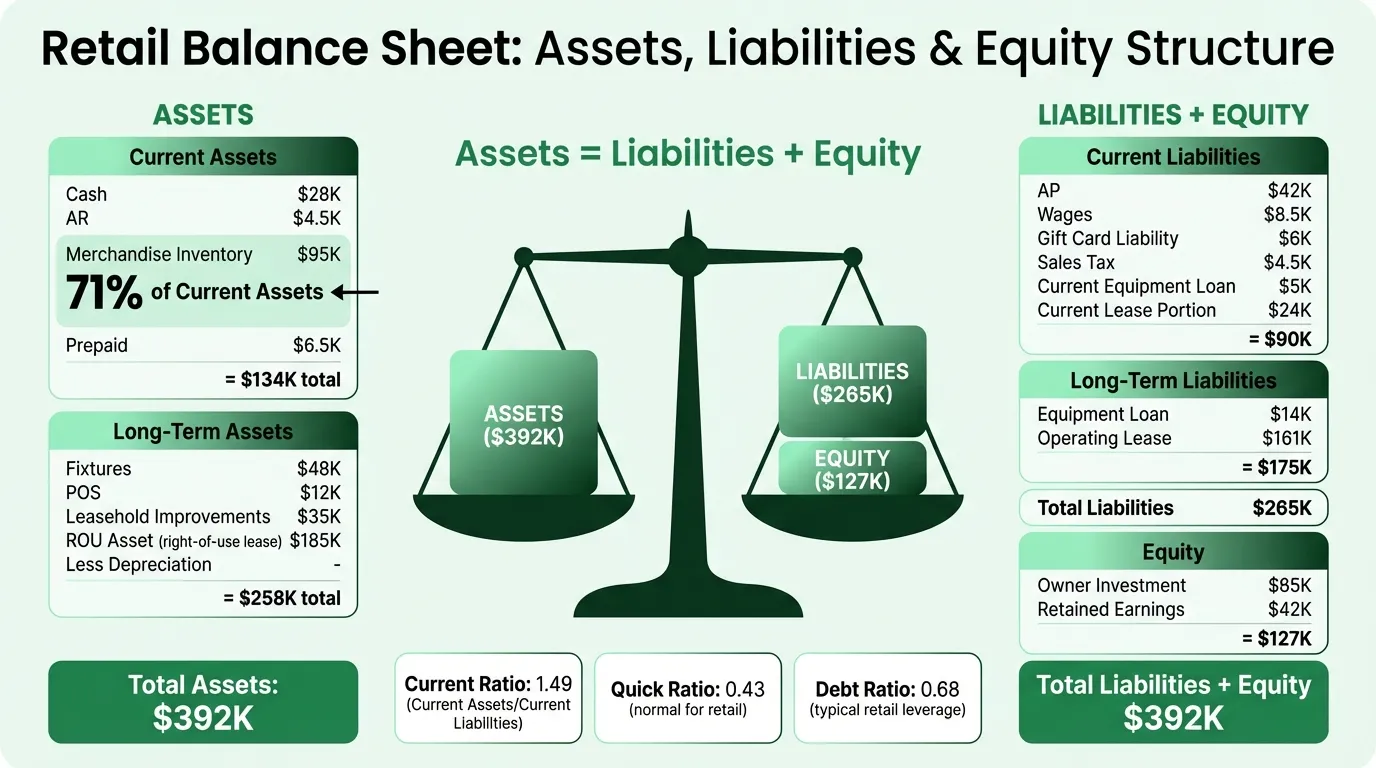
| Cash and cash equivalents | $28,000 |
| Accounts receivable | $4,500 |
| Merchandise inventory | $95,000 |
| Prepaid expenses | $6,500 |
| Total Current Assets | $134,000 |
Long-Term Assets
| Line Item | Amount |
|---|---|
| Store fixtures and display equipment | $48,000 |
| POS and technology systems | $12,000 |
| Leasehold improvements | $35,000 |
| Less: accumulated depreciation | ($22,000) |
| Right-of-use asset (operating lease) | $185,000 |
| Total Long-Term Assets | $258,000 |
Total Assets: $392,000
Liabilities
Current Liabilities
| Line Item | Amount |
|---|---|
| Accounts payable (merchandise vendors) | $42,000 |
| Accrued wages | $8,500 |
| Gift card liability | $6,000 |
| Sales tax payable | $4,500 |
| Current portion of equipment loan | $5,000 |
| Current portion of operating lease | $24,000 |
| Total Current Liabilities | $90,000 |
Long-Term Liabilities
| Line Item | Amount |
|---|---|
| Equipment loan (long-term portion) | $14,000 |
| Operating lease liability (long-term) | $161,000 |
| Total Long-Term Liabilities | $175,000 |
Total Liabilities: $265,000
Equity
| Line Item | Amount |
|---|---|
| Owner's investment | $85,000 |
| Retained earnings | $42,000 |
| Total Equity | $127,000 |
Total Liabilities + Equity: $392,000
Need a ready-made balance sheet template for your retail?
Download a pre-built spreadsheet with industry-specific categories, formulas, and formatting.
What the Numbers Actually Mean
Current Ratio
Current Ratio = Current Assets / Current Liabilities
In this example: $134,000 / $90,000 = 1.49
A current ratio above 1.0 means current assets exceed current liabilities — positive working capital. The retail industry median is approximately 1.25, according to SEC filing data from publicly traded retailers. This is healthier than restaurants, where the ratio runs below 1.0, because retail stores don't operate with the same all-cash, all-immediate payment model.
A current ratio declining toward 1.0 or below is worth investigating. It usually means inventory is growing (and not selling) or payables are stretching past what the business can comfortably handle.
Quick Ratio
Quick Ratio = (Current Assets − Inventory) / Current Liabilities
In this example: ($134,000 − $95,000) / $90,000 = 0.43
The quick ratio strips out inventory because inventory can't always be converted to cash quickly. For most industries, a quick ratio below 1.0 signals risk. For retail, it's structural — the industry median is approximately 0.48. A low quick ratio is acceptable as long as inventory is actually turning. If inventory sits on shelves for six months, a 0.43 quick ratio is a problem. If it sells in 60 days, it isn't.
Inventory as Percentage of Current Assets
In this example: $95,000 / $134,000 = 71%
This is the ratio that most directly captures retail's balance sheet character. Inventory at 60–80% of current assets is normal. If inventory rises above 80% or grows faster than sales, it's a signal — you're buying more than you're selling, or you're carrying dead stock.
Debt Ratio
Debt Ratio = Total Liabilities / Total Assets
In this example: $265,000 / $392,000 = 0.68
The retail industry median debt ratio is approximately 0.70. A 0.68 means 68 cents of every asset dollar is financed by debt or obligations. That's typical leverage for a retailer with store leases and normal supplier payables. ASC 842 pushed this ratio higher across the industry starting in 2022, because previously off-balance-sheet lease obligations now appear as liabilities.
Retail-Specific Items to Monitor
Inventory Health
Inventory is both your biggest asset and your biggest risk. On the balance sheet, the number you want to track is inventory relative to cost of goods sold — which gives you days of inventory on hand.
Days Inventory = (Inventory / COGS) × 365
In this example, if annual COGS is $576,000 (64% of $900,000): ($95,000 / $576,000) × 365 = 60 days
A 60-day inventory cycle is within the healthy range for most general retailers. Apparel and fashion retailers target 30–60 days; home goods and furniture retailers may run 90–145 days. If this number is creeping up quarter over quarter, you're accumulating stock faster than you're selling it. Plug your COGS numbers into our retail profit margin calculator to see how inventory levels affect your margins.
Accounts Payable Relative to Inventory
A useful relationship: accounts payable divided by inventory. If AP is 30–50% of inventory, your supplier financing is working normally. If AP starts to exceed inventory, you may be paying for goods you've already sold — a cash flow warning.
Gift Card Liability Trend
This liability grows each holiday season and draws down through the year as cards are redeemed. A persistently growing gift card liability isn't inherently bad — it means you're selling more cards than are being redeemed — but it's cash you've collected and haven't earned yet. Watch for any large, sudden drops in the liability, which can signal unreported redemptions or accounting errors.
Operating Lease ROU Asset vs. Liability
Under ASC 842, the ROU asset and lease liability will often differ slightly because the asset is amortized differently than the liability reduces. This is expected. What matters: confirm both are recorded, and that the lease term in your accounting software matches your actual lease agreement. A mismatch here can distort your long-term financial picture.
What Lenders Look At
When you apply for an SBA loan, equipment financing, or a line of credit, the lender reviews your balance sheet alongside your income statement and cash flow statement.
| What They Check | What They Want to See |
|---|---|
| Current ratio | Above 1.0, stable or improving |
| Inventory turnover | Consistent with industry; not accumulating |
| Debt ratio | Below 0.80 for new credit approval |
| Equity trend | Retained earnings growing over time |
| Accounts payable | Not stretching past agreed terms |
| Collateral | Fixtures, equipment — what secures the loan? |
A balance sheet showing growing retained earnings, a manageable debt ratio, and inventory that turns at a reasonable pace signals a financially stable operation. One with rising inventory, flat or declining equity, and stretched payables raises questions — even if the income statement looks decent.
Using the Balance Sheet as a Management Tool
Monthly income statement review is common practice in retail. Monthly balance sheet review is less common, and that's where problems hide.
Specifically, check these each month:
- Inventory balance — growing faster than sales? You're over-buying. Flat even as sales grow? You're turning stock efficiently.
- Accounts payable — rising faster than inventory purchases? You're falling behind on supplier payments. That erodes terms and relationships.
- Gift card liability — seasonal fluctuations are expected. Persistent growth in the off-season needs explanation.
- Retained earnings — is equity actually building? If retained earnings are flat despite profitable months, check whether owner draws are offsetting all profits. For a structured view of the metrics that feed into these checks, see our retail KPI benchmarks.
The Retail Balance Sheet Template is structured for this monthly review, with the balance sheet itself and ratio calculations built in. For a complete financial picture, it pairs with the Retail Income Statement Template — which covers revenue, COGS, and profitability — and the Retail P&L Template, which tracks margin performance across categories.
Three documents, three questions: the balance sheet asks what you own and owe, the income statement asks whether you're profitable, and the cash flow statement asks whether you can cover your obligations. None answers the others.
If you're also tracking forward-looking performance, the Retail Budget Template lets you compare planned versus actual across the year — useful for flagging inventory divergences before they compound.
Last updated: March 24, 2026
Frequently Asked Questions
Related Articles
Church Accounting Best Practices: A Practical Guide
How church accounting works — fund accounting, restricted funds, internal controls, financial reports, and the tax rules that catch churches off guard.
Church Balance Sheet Example: A Line-by-Line Breakdown
A complete church balance sheet example with real line items, fund accounting explained, and the benchmarks church boards use to assess financial health.
Construction Accounting: A Practical Guide for Contractors
Construction accounting is different from standard accounting. This guide covers job costing, WIP schedules, retainage, revenue recognition methods, and common mistakes.
Construction Balance Sheet Example: A Line-by-Line Breakdown
A complete construction company balance sheet example with real line items, WIP accounting, retainage, overbilling, and what sureties and lenders look for.
Daycare Balance Sheet Example: Line by Line
A complete daycare balance sheet example with real line items — enrollment deposits, playground equipment, subsidy receivables, and what the numbers mean.
Food Truck Balance Sheet Example: A Line-by-Line Breakdown
A complete food truck balance sheet example with real line items, truck depreciation rules, and what makes a food truck's financials different from a restaurant.