Daycare Balance Sheet Example: Line by Line
A complete daycare balance sheet example with real line items — enrollment deposits, playground equipment, subsidy receivables, and what the numbers mean.
A daycare balance sheet has a few line items you won't see in other industries — enrollment deposits sitting in liabilities, state subsidy receivables waiting to clear, and playground equipment working its way through a 7-year depreciation schedule.
Understanding what each item represents and how the numbers fit together tells you whether your center is financially stable or quietly eroding its equity.
What a Daycare Balance Sheet Looks Like
The structure follows the standard equation: Assets = Liabilities + Equity. What makes it specific to childcare is the composition of each section.
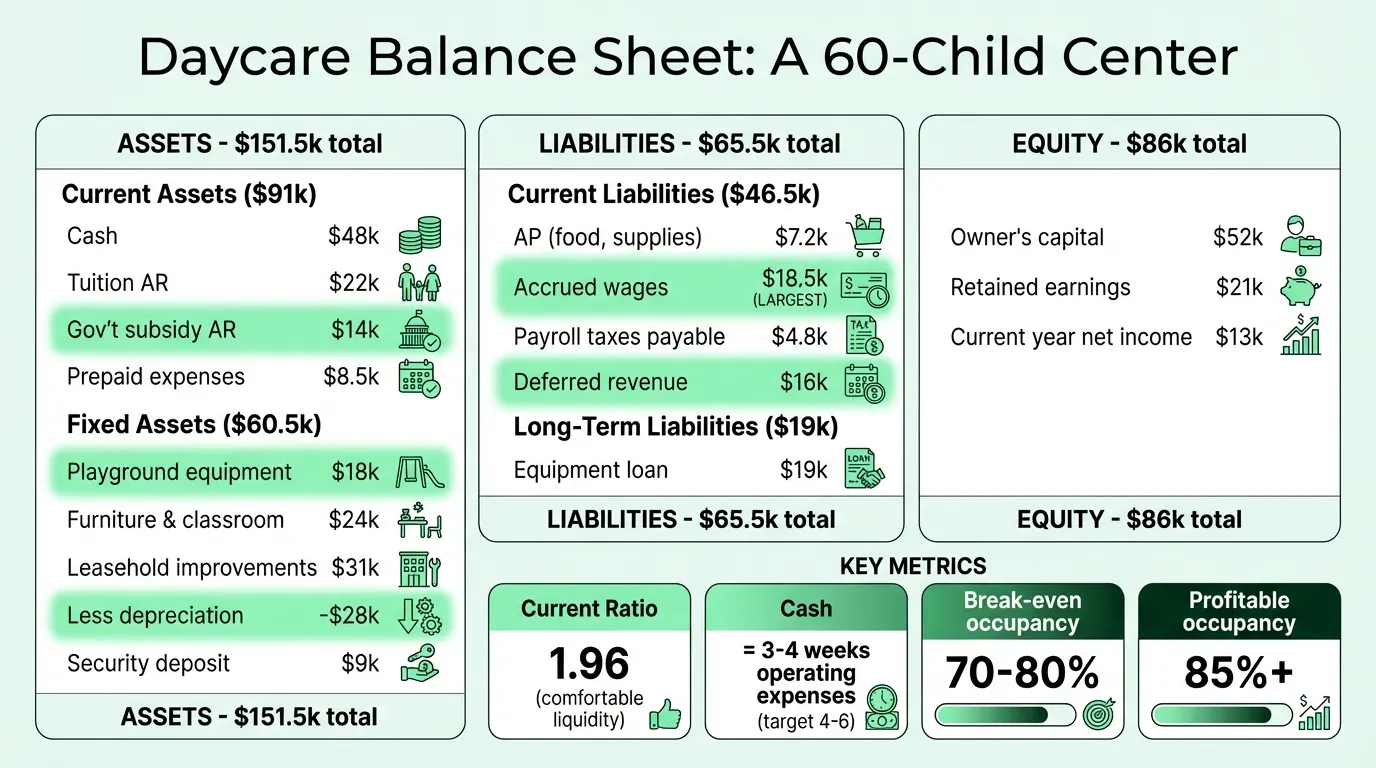
Here's a representative balance sheet for a licensed daycare center with 60 enrolled children and roughly $750,000 in annual revenue:
Assets
Current Assets
| Line Item | Amount |
|---|---|
| Cash and cash equivalents | $48,000 |
| Accounts receivable (tuition owed) | $22,000 |
| Less: allowance for doubtful accounts | ($1,500) |
| Government subsidy receivables | $14,000 |
| Prepaid expenses | $8,500 |
| Total Current Assets | $91,000 |
Fixed Assets
| Line Item | Amount |
|---|---|
| Playground equipment | $18,000 |
| Classroom furniture and equipment | $24,000 |
| Leasehold improvements | $31,000 |
| Computers and administrative equipment | $6,500 |
| Less: accumulated depreciation | ($28,000) |
| Security deposit (leased facility) | $9,000 |
| Total Fixed Assets | $60,500 |
Total Assets: $151,500
Liabilities
Current Liabilities
| Line Item | Amount |
|---|---|
| Accounts payable (supplies, food vendor) | $7,200 |
| Accrued salaries and wages | $18,500 |
| Payroll taxes payable | $4,800 |
| Deferred revenue (tuition deposits, advance payments) | $16,000 |
| Total Current Liabilities | $46,500 |
Long-Term Liabilities
| Line Item | Amount |
|---|---|
| Equipment loan (playground structure, van) | $19,000 |
| Total Long-Term Liabilities | $19,000 |
Total Liabilities: $65,500
Owner's Equity
| Line Item | Amount |
|---|---|
| Owner's capital | $52,000 |
| Retained earnings (prior years) | $21,000 |
| Current year net income | $13,000 |
| Total Owner's Equity | $86,000 |
Total Liabilities and Equity: $151,500
The Line Items That Are Unique to Daycares
Deferred Revenue: The Most Misunderstood Item
Most daycare centers collect money before they deliver the service — registration fees paid in August for a fall start, monthly tuition paid on the first for the month ahead, summer camp deposits collected in March.
All of that money sits on the balance sheet as a liability until the service is actually provided.
This is called deferred revenue (sometimes "unearned revenue" or "advance tuition"), and it's the line item daycare owners most often misclassify. If you received $1,500 in registration fees in September and deposited them in your bank account, the instinct is to call it income. But if 10 families each paid $150 before their child started attending, you still owe either the childcare services or a refund — making it a liability on the date of your balance sheet.
As children attend and you deliver the care, you recognize that amount as revenue. Until then, it stays in liabilities.
A $16,000 deferred revenue balance — as in the example above — is completely normal and healthy. It means you've collected advance payments, which is good for cash flow. The balance disappears as you earn it.
Government Subsidy Receivables
Most licensed daycare centers participate in state childcare assistance programs — subsidies paid by state agencies on behalf of enrolled low-income families. These payments frequently lag 30 to 60 days behind the care you've already provided.
The amount owed to you from the state goes on your balance sheet as an accounts receivable (often broken out separately as "government subsidy receivable" for clarity). It's an asset — money you've earned and are owed, just not yet collected.
If you're also running a Head Start program or receiving Title I funding, those grant reimbursements follow the same logic: you deliver the services first, submit for reimbursement, and the receivable sits on your balance sheet until the check clears.
Playground Equipment and Depreciation
A $15,000 playground structure doesn't become a $15,000 expense in the year you buy it. It's a long-term asset that gets capitalized and depreciated over its useful life — typically 7 years under IRS guidelines.
Each year, roughly $2,143 in depreciation expense reduces the net book value on your balance sheet. After three years, the same structure appears as $15,000 minus $6,429 accumulated depreciation = $8,571 net book value.
This matters for two reasons. First, it smooths the cash impact: the full cash outflow happens when you pay for the equipment, but the income statement expense is spread out. Second, lenders and investors looking at your balance sheet want to see what your fixed assets are actually worth — the net book value after accumulated depreciation gives them that picture.
The same principle applies to leasehold improvements (renovations you made to a rented space) and classroom furniture.
Accrued Payroll: Your Largest Liability
Labor runs 40–65% of revenue at most daycare centers. Weekly payroll cycles mean that on any given balance sheet date, there's almost always a week or more of earned but unpaid wages sitting in current liabilities.
In the example above, accrued salaries of $18,500 represent the largest single liability. This is normal and expected — it doesn't mean the center is in trouble. It means staff have worked hours that haven't yet been paid out.
What would be concerning: if accrued payroll kept growing month over month, or if the center was routinely delaying payroll, which would show up as an unusually large and persistent accrued salaries balance. Tracking these labor costs against revenue is where the daycare income statement picks up — showing whether staff expense ratios are sustainable.
Reading the Numbers: Financial Health Signals
Current Ratio
Current Ratio = Current Assets / Current Liabilities
Example: $91,000 / $46,500 = 1.96
A current ratio above 1.5 means current assets comfortably exceed near-term obligations. Below 1.0 means the center may struggle to cover its bills over the next 12 months. The example center is in reasonable shape — just under the 2.0 threshold that signals a strong position.
Cash Relative to Monthly Expenses
A daycare running $750,000 in annual revenue has monthly operating costs in the range of $50,000–$65,000. Cash on hand of $48,000 represents roughly 3–4 weeks of operating expenses — workable but thin. Most operators target 4–6 weeks of operating expenses as a minimum cash reserve.
Equity Trend
Look at retained earnings year over year. If your balance sheet shows retained earnings declining — meaning cumulative losses are eating into owner's equity — that's a signal the center is spending more than it earns. A growing retained earnings balance means the business is building financial strength over time.
The example center has $21,000 in accumulated retained earnings plus $13,000 in current year net income — a modest but positive picture.
Occupancy-Linked Benchmarks
Balance sheet health in childcare is closely tied to enrollment. Centers typically need 70–80% occupancy to break even, with meaningful profits starting around 85%+. A center operating below 70% will almost certainly show losses on its income statement, which compress equity on the balance sheet over time. Use the daycare break-even calculator to find your center's exact occupancy threshold.
Need a ready-made balance sheet template for your daycare?
Download a pre-built spreadsheet with industry-specific categories, formulas, and formatting.
For-Profit vs. Nonprofit Daycare Balance Sheets
The structure above applies to a for-profit daycare. If your center is organized as a 501(c)(3) nonprofit, a few things change:
- The document is technically called a Statement of Financial Position, not a balance sheet
- Equity becomes Net Assets, typically split between without donor restrictions and with donor restrictions
- Grant funds received with conditions attached appear as restricted net assets — a liability-like classification that signals you haven't yet earned the full use of those funds
- The equation becomes: Assets = Liabilities + Net Assets
For planning how these figures feed into your annual spending plan, see our daycare budget example.
The core line items are the same. What changes is how the ownership interest is classified and whether any funds carry donor-imposed restrictions. Many nonprofit daycares participate in government grant programs that carry specific restrictions on how funds can be spent — those restrictions are tracked and reported through the net asset classification system.
If you're unsure whether your center should be for-profit or nonprofit, the accounting structure isn't the driving consideration. The organizational and tax implications are.
What a Balance Sheet Can't Tell You
The balance sheet is a snapshot at one point in time. It doesn't show:
- Whether this month was stronger or weaker than last year (that's the income statement)
- Whether you'll be able to make payroll next Friday (that's your cash flow projection)
- Whether your enrollment is trending up or down
The Daycare Balance Sheet Template gives you the structure to track the snapshot. For the complete financial picture, it pairs with your income statement to track profitability and a rolling cash flow view to monitor short-term liquidity — particularly important for centers with seasonal enrollment patterns or subsidy payment lags.
Common Errors on Daycare Balance Sheets
Recording deposits as income. The most frequent mistake. Registration fees, enrollment deposits, and advance tuition are liabilities until earned. Booking them as income inflates revenue and understates what you owe families.
Missing government subsidy receivables. If you're billing state programs and not tracking what's owed, your receivables balance is understated and your current ratio looks weaker than it is.
Not capitalizing playground equipment. Expensing a $15,000 playground structure in one year instead of capitalizing and depreciating it creates a large one-time loss that distorts the income statement and leaves the asset off your balance sheet. Track the full impact of equipment purchases with the daycare expense tracker template.
Forgetting security deposits as assets. If you put down a deposit when you signed your lease, that deposit belongs on your balance sheet as a long-term asset (you'll get it back when the lease ends). It's not an expense.
The Daycare Balance Sheet Template is set up with the right line items to avoid these categorization errors — with separate rows for deferred tuition, subsidy receivables, and fixed asset depreciation already built in.
Last updated: March 24, 2026
Frequently Asked Questions
Related Articles
Church Accounting Best Practices: A Practical Guide
How church accounting works — fund accounting, restricted funds, internal controls, financial reports, and the tax rules that catch churches off guard.
Church Balance Sheet Example: A Line-by-Line Breakdown
A complete church balance sheet example with real line items, fund accounting explained, and the benchmarks church boards use to assess financial health.
Construction Accounting: A Practical Guide for Contractors
Construction accounting is different from standard accounting. This guide covers job costing, WIP schedules, retainage, revenue recognition methods, and common mistakes.
Construction Balance Sheet Example: A Line-by-Line Breakdown
A complete construction company balance sheet example with real line items, WIP accounting, retainage, overbilling, and what sureties and lenders look for.
Food Truck Balance Sheet Example: A Line-by-Line Breakdown
A complete food truck balance sheet example with real line items, truck depreciation rules, and what makes a food truck's financials different from a restaurant.
Healthcare Balance Sheet Example: A Line-by-Line Breakdown
A complete healthcare balance sheet example for a medical practice — covers contractual adjustments, days in AR, malpractice reserves, and key financial ratios.