Construction Balance Sheet Example: A Line-by-Line Breakdown
A complete construction company balance sheet example with real line items, WIP accounting, retainage, overbilling, and what sureties and lenders look for.
Construction balance sheets look different from nearly every other industry. The same basic structure applies — Assets = Liabilities + Equity — but the specific line items reflect the realities of project-based work: retainage held by owners, work-in-progress calculated by percentage of completion, and the overbilling or underbilling that builds up on every active project.
Understanding what those line items mean — and what's normal versus what's a warning sign — matters whether you're reviewing your own financials, preparing for a surety bond application, or applying for a line of credit.
What Makes a Construction Balance Sheet Different
Most businesses track a handful of straightforward assets and liabilities. Construction adds four categories that require specific accounting knowledge:
Retainage receivable. When an owner pays progress billings, they typically withhold 5–10% of each payment until the project reaches substantial completion. That withheld amount accumulates as retainage receivable — money you've earned but can't collect yet. On a $2M project with 10% retainage, you could have $200,000 sitting in this account for the duration of the job.
Retainage payable. General contractors typically mirror this practice with their subcontractors — withholding the same percentage from sub payments. That creates a corresponding liability, retainage payable.
Costs in excess of billings (underbilling). If you've incurred more costs (or completed more work) than you've billed, the difference is an asset — you've earned revenue you haven't yet invoiced. It's also a warning flag: significant underbilling means you're financing the project without compensation.
Billings in excess of costs (overbilling). The opposite: you've billed more than the work completed would justify. This appears as a current liability, because you've collected cash you haven't yet earned through completed work.
One additional accounting note: under GAAP, contract-related assets and liabilities (including retainage) are typically classified as current — even if they won't settle within 12 months — because they're expected to liquidate through the normal project completion cycle.
Complete Example: General Contractor
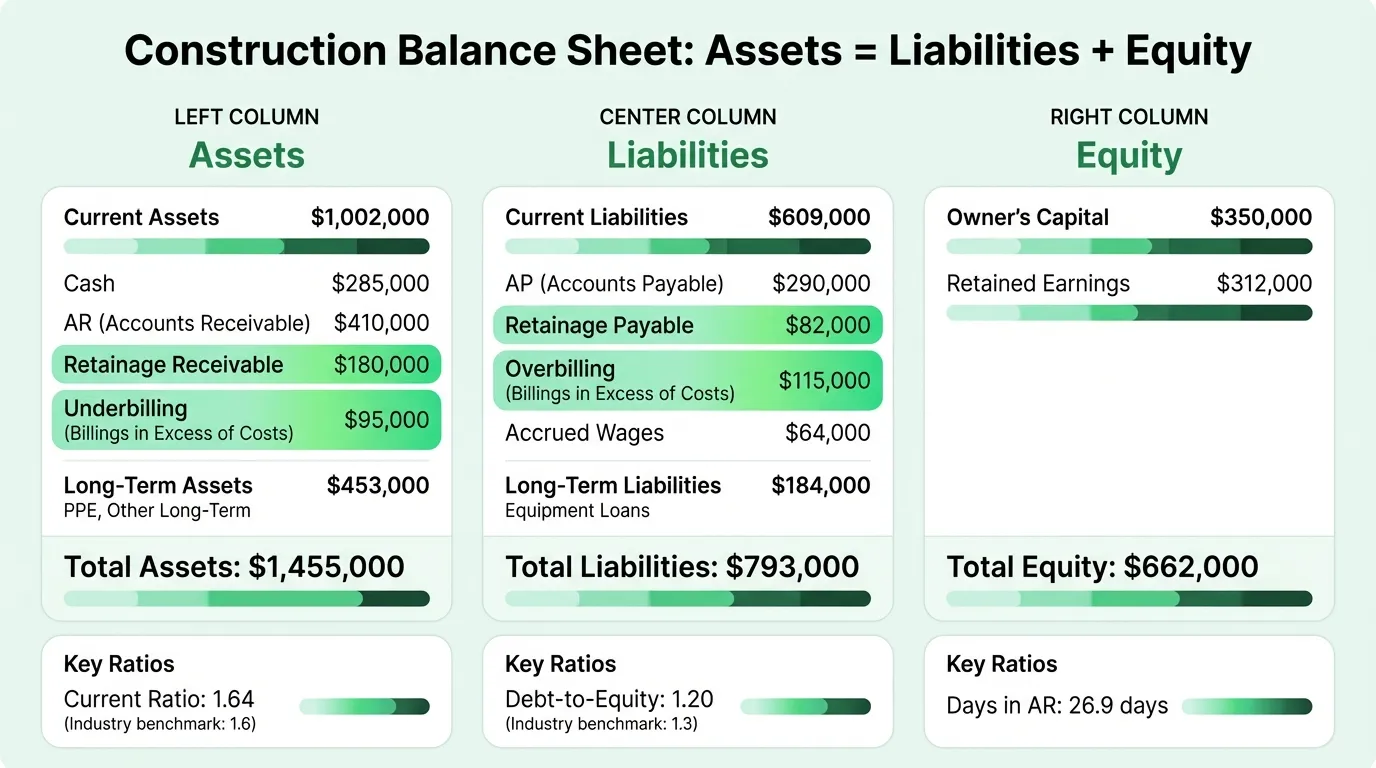
Here's a representative balance sheet for a mid-size general contractor with approximately $8M in annual revenue, carrying four active projects at various stages of completion:
Assets
Current Assets
| Line Item | Amount |
|---|---|
| Cash and cash equivalents | $285,000 |
| Accounts receivable (billed, not yet collected) | $410,000 |
| Retainage receivable | $180,000 |
| Costs in excess of billings (underbilling) | $95,000 |
| Prepaid expenses and deposits | $32,000 |
| Total Current Assets | $1,002,000 |
Long-Term Assets
| Line Item | Amount |
|---|---|
| Construction equipment and vehicles | $620,000 |
| Office furniture and equipment | $48,000 |
| Less: accumulated depreciation | ($215,000) |
| Total Long-Term Assets | $453,000 |
Total Assets: $1,455,000
Liabilities
Current Liabilities
| Line Item | Amount |
|---|---|
| Accounts payable (suppliers and subcontractors) | $290,000 |
| Retainage payable (withheld from subcontractors) | $82,000 |
| Billings in excess of costs (overbilling) | $115,000 |
| Accrued wages and payroll taxes | $64,000 |
| Current portion of equipment loans | $58,000 |
| Total Current Liabilities | $609,000 |
Long-Term Liabilities
| Line Item | Amount |
|---|---|
| Equipment loans (long-term portion) | $184,000 |
| Total Long-Term Liabilities | $184,000 |
Total Liabilities: $793,000
Equity
| Line Item | Amount |
|---|---|
| Owner's capital contributions | $350,000 |
| Retained earnings | $312,000 |
| Total Equity | $662,000 |
Total Liabilities + Equity: $1,455,000
Reading the Key Ratios
Current Ratio
Current Ratio = Current Assets / Current Liabilities
In this example: $1,002,000 / $609,000 = 1.64
According to CFMA's 2024 Construction Financial Benchmarker — based on 2023 financial data from 1,290 construction companies — the industry average current ratio is 1.6. This example is right at the benchmark.
Construction companies need to carry higher liquidity than most industries because they fund materials, labor, and subcontractor payments before billing cycles catch up. A current ratio below 1.1 signals potential trouble; a ratio trending downward over 6–12 months warrants action even if it's still above 1.0. Run your own numbers through the construction cash flow calculator to see where your liquidity stands.
Debt-to-Equity Ratio
Debt-to-Equity = Total Liabilities / Total Equity
In this example: $793,000 / $662,000 = 1.20
The CFMA benchmark for the industry average is 1.3x, with best-in-class contractors running 0.9x. This company is slightly better than average. For context: a ratio above 2.0 is a concern for lenders and surety underwriters; above 3.0 typically means the business won't qualify for bonding on large projects.
Days in Accounts Receivable
Days in AR = (Accounts Receivable / Annual Revenue) × 365
In this example: ($410,000 / $8,000,000) × 365 = 18.7 days
This looks low compared to the CFMA benchmark of 56.6 days — that's because the example's accounts receivable is just the current period's receivables, not retainage. Including retainage receivable ($180,000): ($590,000 / $8,000,000) × 365 = 26.9 days combined. A days-in-AR figure above 60–70 days suggests billing or collection problems.
The WIP Schedule: Where the Real Story Is
The balance sheet shows the results of WIP accounting — costs in excess of billings and billings in excess of costs — but not the underlying calculations. Those come from the WIP schedule, which every active project should have.
The core calculation for each project:
- Percent complete = Costs incurred to date ÷ Total estimated costs
- Earned revenue = Percent complete × Total contract value
- Over/underbilling = Billings to date − Earned revenue
A project that is 40% complete on a $1M contract has earned $400,000 in revenue. If you've billed $450,000, you have $50,000 in overbilling (a liability). If you've billed $360,000, you have $40,000 in underbilling (an asset).
The WIP schedule rolls up all active projects and produces the two figures that land on the balance sheet. Sureties and bonding companies review it in detail — not just the totals — because it reveals whether projects are running over budget, whether cash is being borrowed across jobs, and whether the company's reported profitability is realistic. Our construction accounting guide covers the full WIP methodology and how it connects to revenue recognition.
Common WIP warning signs:
- A project consistently showing large underbilling (billing falling behind costs) — often means the job is in trouble
- Overbilling that grows over time — suggests "job borrowing," using advance billings on one project to fund another
- Total WIP position that changes dramatically month to month — accuracy concerns
Need a ready-made balance sheet template for your construction?
Download a pre-built spreadsheet with industry-specific categories, formulas, and formatting.
Retainage: The Contractor's Working Capital Problem
In the example above, $180,000 is sitting in retainage receivable. That's money earned, work completed, but not yet collected. For a company doing $8M annually with 10% retainage held, it's not unusual to have $500,000–$800,000 in outstanding retainage across all active and recently completed projects.
Here's why this matters: the CFMA benchmark for net income before taxes in construction is 6.3% of revenue. On $8M, that's $504,000. Retainage can easily equal your entire annual profit margin sitting uncollected.
The accounting treatment is straightforward:
- Retainage receivable (your asset): Debit Retainage Receivable, Credit Accounts Receivable when retainage is withheld from a payment application
- Retainage payable (your liability): Debit Accounts Payable, Credit Retainage Payable when you withhold from a subcontractor
Track retainage by project and expected release date. Retainage that's more than 90 days past the expected release date should be actively pursued — it's cash that belongs to you. Our construction cash flow example shows exactly how retainage holdbacks create timing gaps between earned revenue and collected cash.
What Sureties and Lenders Look For
A construction balance sheet is scrutinized differently than most business financials because the surety bonding process depends on it. Sureties — the insurance companies that back your performance and payment bonds — analyze your balance sheet closely before issuing bonds on large projects.
| What They Check | What They Want to See |
|---|---|
| Current ratio | Above 1.1 minimum; 1.5+ preferred |
| Debt-to-equity | Below 2.0; below 1.0 for best bonding terms |
| Net worth (equity) | Growing year over year |
| Working capital | Sufficient to fund the bonded project scope |
| WIP position | Balanced; no large chronic underbillings |
| Retainage balances | Tracked and collectible; not stale |
| Equipment value | Realistic depreciation; well-maintained fleet |
| Overbilling | Not used as a persistent cash flow strategy |
A balance sheet that shows growing equity, a clean WIP position, and retainage actively being released signals a well-managed operation. One with declining equity, large overbilling, and stale retainage tells a different story.
For bank lenders specifically, the focus shifts more toward cash flow coverage — whether operating income can service the debt load — alongside the balance sheet ratios above.
Equipment: The Other Major Asset
Unlike restaurants or service businesses, construction companies carry significant equipment assets. In the example, $620,000 in gross equipment value (before depreciation) represents heavy machinery, trucks, and specialty tools.
Equipment matters on the balance sheet for three reasons:
-
Collateral for equipment loans. Most construction equipment is financed, and the loans are secured by the equipment itself. Lenders want to see net book value (cost minus depreciation) that supports the outstanding loan balance.
-
Depreciation drag on income. A $300,000 excavator depreciated over 5 years adds $60,000 per year in depreciation expense. This reduces reported income even though no cash left the business that year. Understanding the depreciation schedule helps explain why a profitable company can still show modest equity growth. The construction income statement example breaks down how depreciation flows through the P&L alongside other job costs.
-
Replacement timing. Equipment nearing full depreciation on the balance sheet (low net book value) may need replacement soon — a cash outflow that the income statement won't show until it happens.
Building and Reviewing Your Balance Sheet
For most construction businesses, the balance sheet is the hardest financial statement to maintain accurately — because it requires getting the WIP calculations right every period, tracking retainage by project, and properly splitting equipment loan balances between current and long-term.
The Construction Balance Sheet Template is built for this — with sections for WIP, retainage tracking, and equipment depreciation schedules already in place.
For a complete financial picture, it pairs with the Construction P&L Template (which tracks job cost and overhead against revenue) and the Construction Cash Flow Template (which shows whether project timing is creating cash shortfalls even when the business is profitable).
The balance sheet answers what you own and owe at a point in time. The P&L answers whether jobs are profitable. The cash flow statement answers whether you can make payroll and pay subs while those profits materialize. In construction, all three are necessary — and the balance sheet is the one most contractors least often review.
Last updated: March 24, 2026
Frequently Asked Questions
Related Articles
Church Accounting Best Practices: A Practical Guide
How church accounting works — fund accounting, restricted funds, internal controls, financial reports, and the tax rules that catch churches off guard.
Church Balance Sheet Example: A Line-by-Line Breakdown
A complete church balance sheet example with real line items, fund accounting explained, and the benchmarks church boards use to assess financial health.
Construction Accounting: A Practical Guide for Contractors
Construction accounting is different from standard accounting. This guide covers job costing, WIP schedules, retainage, revenue recognition methods, and common mistakes.
Daycare Balance Sheet Example: Line by Line
A complete daycare balance sheet example with real line items — enrollment deposits, playground equipment, subsidy receivables, and what the numbers mean.
Food Truck Balance Sheet Example: A Line-by-Line Breakdown
A complete food truck balance sheet example with real line items, truck depreciation rules, and what makes a food truck's financials different from a restaurant.
Healthcare Balance Sheet Example: A Line-by-Line Breakdown
A complete healthcare balance sheet example for a medical practice — covers contractual adjustments, days in AR, malpractice reserves, and key financial ratios.