Daycare Budget Example: Categories, Benchmarks, and What to Watch
A practical daycare budget example covering revenue sources, expense ratios, occupancy thresholds, and the line items that determine whether a center stays financially viable.
The average cost of center-based childcare reached $13,128 per child annually in 2024 — a 13.4% increase in a single year, according to Child Care Aware of America. Despite rising tuition rates, most daycare centers operate on net margins of 1–5%. The gap between what families pay and what operators keep comes down to labor, occupancy, and a budget structure that most centers don't have clearly mapped out.
Here's what a functional daycare budget looks like, with real benchmarks for each line.
How a Daycare Budget Is Structured
A daycare budget has two sides: revenue sources and expense categories. Unlike most small businesses, both sides are partially constrained by external forces — state licensing requirements set minimum staffing levels, subsidy programs affect revenue timing, and licensed capacity creates a hard ceiling on what you can earn.
Revenue Sources
Tuition is the dominant revenue stream for most centers — typically around 90% of total income. The rest comes from a mix of fees and program reimbursements.
| Revenue Source | Typical % of Total |
|---|---|
| Tuition (full-time enrollment) | ~85–90% |
| Registration and enrollment fees | ~3% |
| CACFP food program reimbursements | ~4% |
| Drop-in care, late pickup fees | ~2% |
| Enrichment programs, before/after school | ~1–2% |
Tuition rates vary significantly by age group because staffing costs vary. Infant rooms require the most staff per occupied slot, which is why infant tuition often runs $300–$500/month higher than preschool. Nationally, average monthly tuition is approximately $1,800 for infants, $1,400–$1,600 for toddlers, and $1,000–$1,400 for preschoolers.
One revenue line that many centers underutilize: CACFP reimbursements. The USDA reimburses licensed centers for meals served to eligible children — up to $4.38 per lunch for free-eligible children in 2025–26. For centers serving lower-income families, this can meaningfully offset food costs. Centers that qualify but don't participate are leaving real money on the table.
If your center accepts government subsidies through your state's CCDF program, budget subsidy payments as a distinct revenue line — and note that these payments typically arrive 30–60 days after services are rendered. That lag creates cash flow gaps that need to be planned for. You can model the timing with the daycare cash flow calculator.
Expense Categories
| Category | % of Revenue |
|---|---|
| Staff compensation and benefits | 65–80% |
| Facility (rent and utilities) | 15–20% |
| Food and nutrition | 5–7% |
| Curriculum and supplies | 3–5% |
| Insurance | ~3% |
| Licensing and compliance | ~1% |
| Software and administration | ~2% |
| Marketing | ~1–2% |
| Professional development | ~1% |
| Operating reserve contribution | ~1–2% |
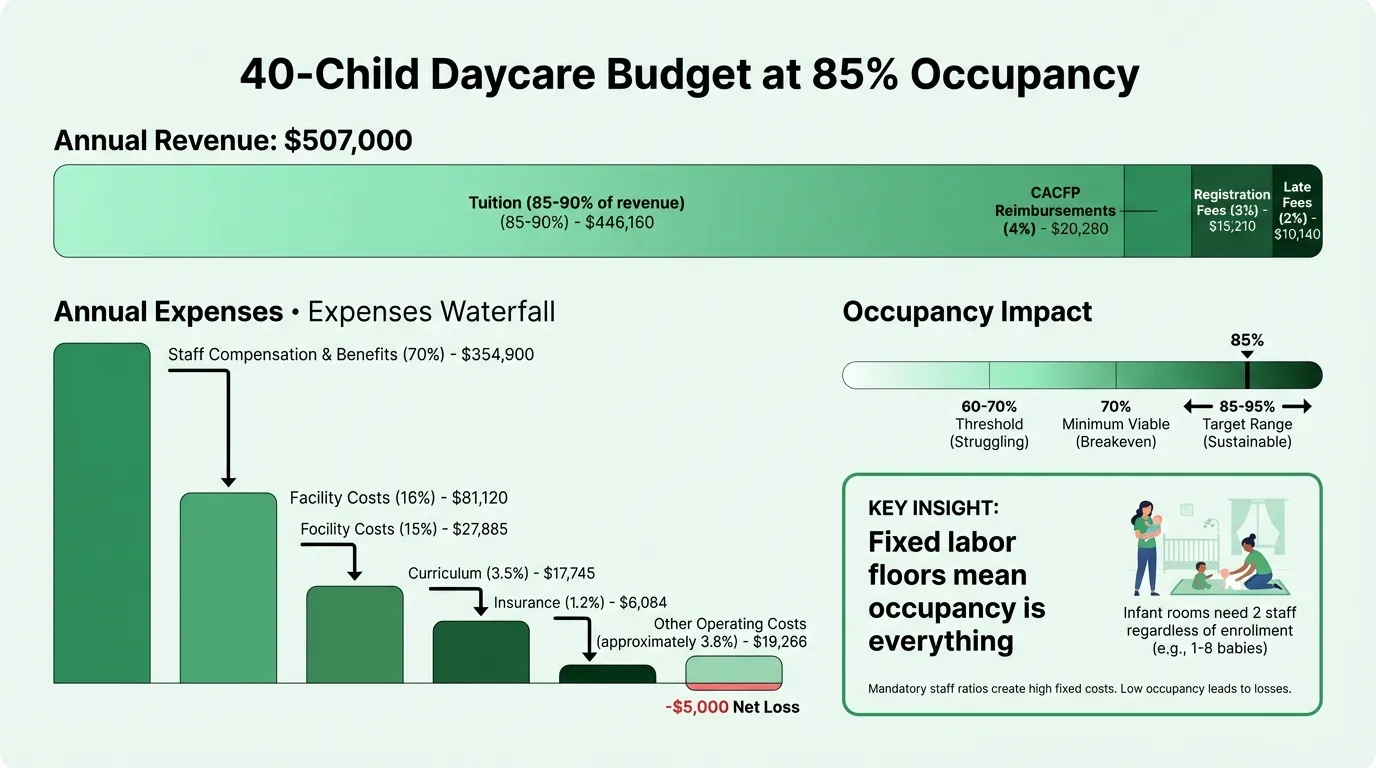
A Concrete Budget Example: 40-Child Center
Here's a realistic annual budget for a 40-child center operating at 85% occupancy (34 enrolled children), with a mix of age groups and average monthly tuition of $1,150:
Revenue
| Source | Annual Amount |
|---|---|
| Tuition (34 children × $1,150 × 12) | $469,200 |
| Registration fees | $13,600 |
| CACFP reimbursements | $18,000 |
| Late fees and drop-in care | $6,200 |
| Total Revenue | $507,000 |
Expenses
| Category | Annual Amount | % of Revenue |
|---|---|---|
| Staff salaries and benefits | $356,000 | 70% |
| Rent and utilities | $80,000 | 16% |
| Food and nutrition | $28,000 | 5.5% |
| Curriculum and supplies | $18,000 | 3.5% |
| Insurance | $6,000 | 1.2% |
| Licensing and compliance | $4,000 | 0.8% |
| Software (enrollment, billing) | $5,000 | 1% |
| Marketing | $6,000 | 1.2% |
| Professional development | $4,000 | 0.8% |
| Operating reserve contribution | $5,000 | 1% |
| Total Expenses | $512,000 |
Net income: -$5,000 — this center needs to either increase enrollment, adjust tuition, or reduce costs to break even. At 90% occupancy (36 children), total tuition rises to roughly $496,800, which brings it to a slim positive margin.
This is not a pessimistic example — it reflects the reality of daycare economics. Margins are genuinely thin, and small changes in occupancy or labor costs move the needle significantly. For a full worked P&L with these dynamics, see our daycare income statement example.
Why Labor Is So Different for Daycare
In most small businesses, labor is a variable cost — you can reduce hours when business is slow. In childcare, state licensing requirements set hard minimums on staffing based on age group and room capacity.
NAEYC recommended staff-to-child ratios:
| Age Group | Recommended Ratio | Max Group Size |
|---|---|---|
| Infants (0–12 months) | 1:3–1:4 | 8 |
| Toddlers (12–30 months) | 1:4–1:6 | 12 |
| Two-year-olds | 1:6 | 12 |
| Preschool (3–5 years) | 1:9–1:10 | 20 |
The practical implication: an infant room with 8 babies requires at least 2 qualified adults regardless of enrollment levels. If two infants unenroll and the room drops to 6, you still need 2 staff. That's the labor floor — you can't go below it without violating licensing requirements.
This is why infant rooms are the most margin-constrained slots in a daycare. They generate the highest tuition but require the most staff. The economics improve significantly with older age groups.
Child care workers earn a median of $33,140 annually (Bureau of Labor Statistics, 2023). Many centers pay below this to hold labor costs down — which then drives the 30–40% annual staff turnover rates that are common in the industry. Each departure triggers recruiting and onboarding costs that are rarely built into budgets. A realistic labor budget accounts for turnover: if you have 12 staff and expect 30% turnover, budget for roughly 4 hiring cycles per year.
Need a ready-made budget template for your daycare?
Download a pre-built spreadsheet with industry-specific categories, formulas, and formatting.
Occupancy Is Everything
The single variable that most determines daycare financial health isn't tuition rates or vendor negotiations — it's occupancy.
Most fixed costs (rent, base staffing, insurance, software) don't change whether you have 30 children enrolled or 40. Every enrolled child above your fixed-cost break-even threshold adds incremental margin. Every slot below that threshold is incremental loss.
Practical occupancy benchmarks:
- Below 60–70%: Most centers cannot cover fixed costs
- 70%: Minimum viable threshold (Hinge Early Education Advisors)
- 85–95%: Target range for financial health
- Monthly churn target: Under 5% to maintain stable enrollment
The implication for budgeting: never build your annual plan around 100% occupancy. Model at 75–80% as your base case, 85–90% as an optimistic case, and 60–65% as your stress scenario. If the 60–65% scenario is existential, you need more cushion.
New centers ramp slowly. Expect 20–30% occupancy in the first 1–3 months, 60–70% by months 4–8, and 85–95% around months 9–12 if marketing is consistent. Building a first-year budget around 85% occupancy from month one will create a cash crisis.
Common Daycare Budget Mistakes
Setting tuition based on competitors rather than costs. Most operators copy a competitor's rate without calculating their own cost per enrolled child. If your total operating cost per child exceeds what you're charging, higher occupancy just means losing more money faster. Calculate your break-even tuition first, then position against market rates.
No marketing budget. Since tuition is 90% of revenue, an empty slot is expensive — a single unfilled preschool spot at $1,200/month represents $14,400 in annual lost revenue. Many operators skip marketing because it feels optional. It isn't. Budget 1–2% of revenue for marketing, which for most small centers means $5,000–$10,000 annually.
Forgetting subsidy payment timing. State CCDF subsidy payments typically arrive 30–60 days after services are rendered. If 20% of your enrolled children are on subsidy, you may have $10,000–$20,000 in earned-but-unpaid revenue at any given time. Cash flow planning needs to account for this lag.
No contingency fund. An HVAC system failure, a burst pipe, or an unexpected licensing requirement can require $10,000–$30,000 on short notice. Industry guidance recommends holding 10–20% of monthly expenses in reserve. Centers without a cash cushion face existential decisions over routine facility issues. Track your reserves against liabilities with the daycare balance sheet.
Treating professional development as optional. Many states require minimum annual training hours for licensed staff. If those requirements aren't met, the license is at risk — and losing a license means losing subsidy program eligibility immediately. Budget professional development as a compliance cost ($500–$1,000 per staff member annually), not a discretionary benefit.
Underestimating startup costs. First-time operators routinely underestimate: facility preparation ($15,000–$50,000), initial supply inventory, licensing fees, background check costs, and the cash needed to sustain the operation during the slow enrollment ramp. Total startup costs for a commercial center typically range from $60,000 to several hundred thousand dollars.
What Licensing Agencies and Funders Look For
When licensing agencies review your operation or when you apply for grants, certain budget line items get scrutinized:
Licensing agencies focus on:
- Staff-to-child ratio compliance — can you demonstrate you're budgeting adequate staffing for each age group?
- Training expenditures — are staff getting required professional development?
- Health and safety line items — sanitation, first aid supplies, facility maintenance
Grant funders and subsidy programs focus on:
- A valid, current childcare license (required for most subsidy programs)
- Tuition rates compared to state market rate surveys (subsidies have reimbursement ceilings)
- Staff wages — quality improvement funders increasingly look at compensation levels
- CACFP participation (or a reason why the center doesn't participate)
- Operating reserves — funders want to see centers can sustain operations after one grant cycle ends
If you're applying for Quality Rating and Improvement System (QRIS) funding, expect scrutiny of your staff compensation scale, professional development expenditures, and ratio compliance history. For a structured starting point, see our daycare expense tracker template.
Building Your Daycare Budget
A Daycare Budget Template gives you the structure to work from — revenue by source including CACFP and subsidy lines, expenses by category with labor broken out by room and age group, occupancy scenario modeling, and a cash flow view that accounts for subsidy payment lags.
If you're also tracking financial performance over time, a Daycare Balance Sheet Template shows assets, liabilities, and equity at a point in time, while a Daycare Income Statement Template tracks revenue and expenses over a period. The budget is your plan; these statements show whether you hit it.
Start with realistic occupancy assumptions. A budget built on 100% occupancy that misses by 20% doesn't just mean lower profit — it means cash shortfall. The operators who manage daycare finances well build plans that can survive the scenarios that actually happen, not just the best-case version.
Last updated: March 23, 2026
Frequently Asked Questions
Related Articles
Coffee Shop Budget Example: Real Numbers and Benchmarks
A practical coffee shop budget example with real cost benchmarks — covering beverage COGS, labor, rent, equipment maintenance, and the line items most operators underestimate.
Church Budget Example: Categories, Percentages, and What to Include
A practical church budget example with real percentages for staff, facilities, missions, and programs — plus the line items most churches overlook.
Construction Budget Example: Line Items, Percentages, and What to Include
A practical construction budget example covering hard costs, soft costs, overhead allocation, and the line items most contractors underestimate.
Event Planning Budget Example: Real Numbers for Your Business
A practical event planning budget example covering agency overhead, per-event costs, revenue models, and the benchmarks every planner needs to protect margins.
Hotel Budget Example: Departments, Benchmarks, and Real Numbers
A practical hotel budget example covering the USALI department structure, labor benchmarks, GOP targets, and the line items independent hoteliers most often miss.
What Is a Good Landscaping Budget? Benchmarks and Examples
A landscaping business budget breakdown covering labor, materials, equipment, overhead benchmarks, and the margin targets that separate profitable companies from struggling ones.