Daycare Income Statement Example: Revenue, Costs, and Margins
A daycare income statement example with tuition revenue, CACFP reimbursements, staff cost benchmarks, and a worked P&L for a 50-child childcare center.
Daycare income statements look straightforward on paper — tuition in, expenses out — but the economics are more complex than most service businesses. Labor costs run 65–80% of revenue, state-mandated staffing ratios create a fixed cost floor that doesn't flex with enrollment, and multiple government programs add revenue lines that most operators manage inconsistently.
Understanding how each layer works — from tuition structure to CACFP reimbursements to occupancy math — is what separates a center that earns a sustainable margin from one that technically stays open while the owner goes unpaid.
Revenue: More Than Just Tuition
Tuition is the core revenue line for most childcare centers, but it's rarely the only one. The full revenue picture:
Tuition by program. Most centers track tuition by age group or program type, because rates and staffing ratios differ. National average monthly rates in 2024 (Child Care Aware of America):
| Age Group | Monthly Rate (National Avg) |
|---|---|
| Infants (0–12 months) | $1,230–$1,800 |
| Toddlers (1–2 years) | $950–$1,200 |
| Preschool (3–5 years) | $700–$1,000 |
| School-age before/after care | $400–$700 |
Centers in higher-cost metro areas run 30–50% above these figures; rural and lower-cost markets run below them.
Government subsidy payments. The Child Care and Development Fund (CCDF) provides vouchers to low-income working families, which flow to the center as direct payments. Centers in neighborhoods with higher subsidy eligibility can derive 20–40% of total revenue from CCDF. These payments arrive on a schedule that lags 30–90 days behind service delivery — a meaningful cash flow consideration.
CACFP meal reimbursements. The USDA's Child and Adult Care Food Program reimburses centers for meals and snacks served to enrolled children. FY2025–2026 reimbursement rates for the free-meal tier: $1.70 per breakfast, $3.75 per lunch or supper, $1.06 per snack. For a 50-child center serving 2 meals and 1 snack daily across 250 operating days, CACFP reimbursements can offset $20,000–$30,000 in annual food costs — a meaningful line for thin-margin operations.
Registration and activity fees. One-time enrollment fees ($50–$200 per child per year) and ongoing activity charges are minor revenue lines but worth separating in the income statement for clarity.
Staff Costs: The Dominant Line
No other industry constraint shapes a childcare income statement the way state-mandated staffing ratios do. Common requirements: 1 teacher per 4 infants, 1 per 6 toddlers, 1 per 10 preschoolers. These ratios create a labor cost floor that exists regardless of whether every slot is filled.
Staff wages and benefits typically represent 65–80% of total revenue at well-run centers. For most small independent operators, it's toward the upper end. The breakdown:
- Teaching and aide staff wages: 45–55% of revenue
- Director and administrative salaries: 8–12% of revenue
- Payroll taxes (FICA, FUTA, SUTA): ~10% of gross wages
- Benefits (health insurance, retirement): 15–20% of salary cost
Despite consuming most of the revenue, childcare worker wages remain low. The Bureau of Labor Statistics reported a median hourly wage of $14.60 for childcare workers in May 2023 — a dynamic that creates persistent turnover. To plan staffing costs alongside your other expense categories, see our daycare budget example. The Federal Reserve Bank of Cleveland found childcare sector turnover was 65% higher than the median occupation in 2022, with center-level annual turnover averaging 21%. Every departure means recruiting costs, background check fees, and weeks of reduced productivity on a staff that's already stretched thin.
Facility and Operating Costs
After labor, the second-largest cost category is occupancy. Rent or mortgage runs 15–20% of revenue for most centers, with higher-end markets approaching 25%. Utilities, cleaning, and maintenance bring the total facility cost to 18–25%.
The other operating lines:
| Expense | Typical % of Revenue |
|---|---|
| Food and kitchen supplies (net of CACFP) | 3–7% |
| Educational supplies and curriculum | 2–4% |
| Equipment and maintenance | 3–5% |
| Liability and workers' comp insurance | 2–3% |
| Licensing, permits, and regulatory fees | 1–2% |
| Software and technology (childcare management) | 1–2% |
| Marketing and advertising | 1–3% |
| Professional services (accounting, legal) | 1–2% |
Food costs deserve special mention because CACFP reimbursements offset a meaningful portion of them. A center running $25,000–$35,000 in annual food costs that participates in CACFP may net $5,000–$15,000 after reimbursements depending on its income-eligible enrollment percentage. The income statement should show gross food expense and CACFP reimbursement revenue separately so both sides of the picture are visible. Use the daycare profit margin calculator to see how CACFP participation affects your net margin.
Full Income Statement Structure
A daycare income statement organized for management decision-making:
Revenue
- Tuition — infants
- Tuition — toddlers
- Tuition — preschool
- Tuition — before/after school care
- Government subsidy payments (CCDF)
- CACFP meal reimbursements
- Registration and activity fees
- Total Revenue
Direct Service Costs
- Teaching and aide wages
- Payroll taxes on direct staff
- Food and kitchen supplies
- Classroom supplies and curriculum materials
- Gross Profit
Operating Expenses
- Director and administrative salaries
- Employee benefits (health, retirement)
- Payroll taxes on administrative staff
- Rent / mortgage
- Utilities
- Liability insurance
- Workers' compensation insurance
- Equipment and maintenance
- Cleaning and janitorial
- Licensing and regulatory fees
- Staff training and professional development
- Software and technology
- Marketing
- Professional services
- Total Operating Expenses
Operating Income
- Interest expense (if applicable)
- Depreciation
Net Income
Need a ready-made income statement template for your daycare?
Download a pre-built spreadsheet with industry-specific categories, formulas, and formatting.
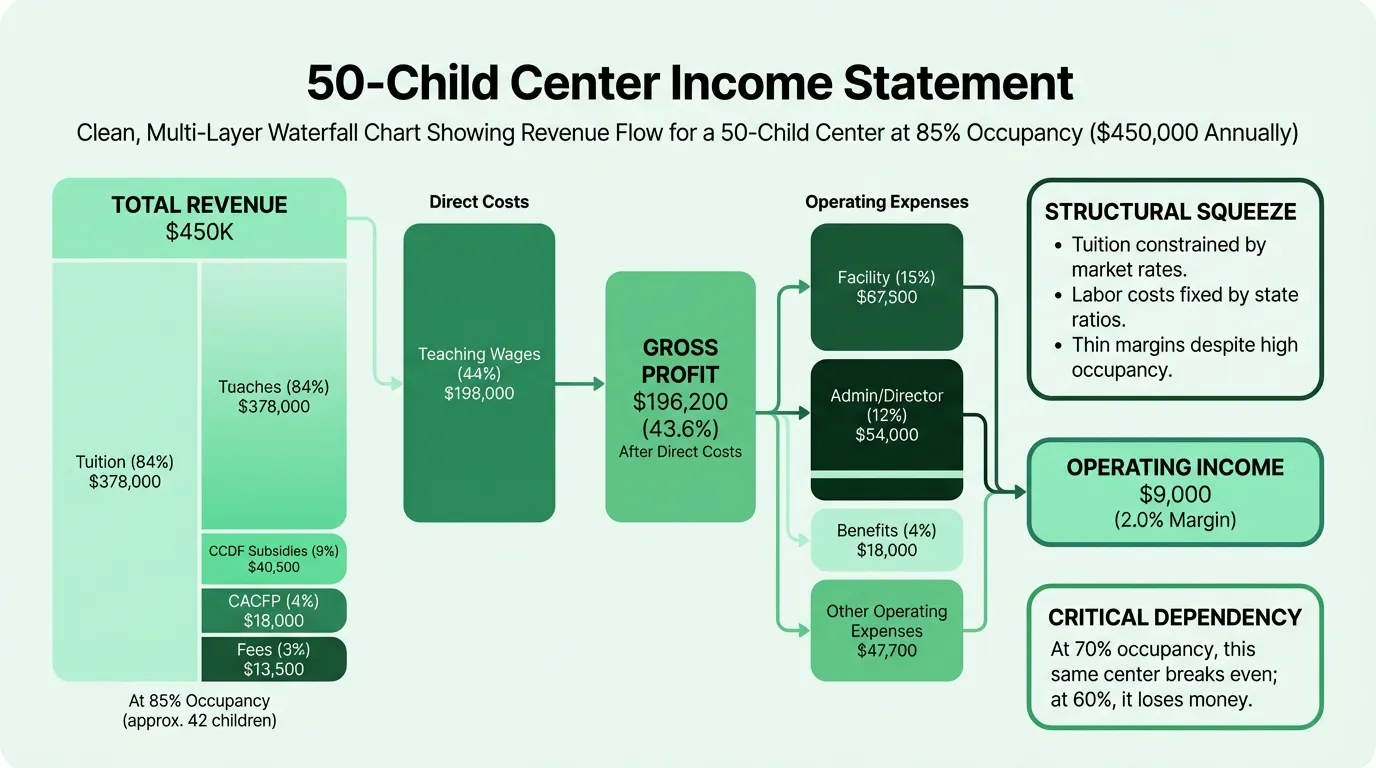
Worked Example: 50-Child Center
Here's a realistic annual income statement for a 50-child center at 85% occupancy, with a mixed age group and active CACFP participation. Revenue reflects a weighted average of approximately $750/child/month across age groups:
Revenue
| Line | Annual | % of Revenue |
|---|---|---|
| Tuition — full-time enrollment | $378,000 | 84.0% |
| Government subsidy payments (CCDF) | $40,500 | 9.0% |
| CACFP meal reimbursements | $18,000 | 4.0% |
| Registration and activity fees | $13,500 | 3.0% |
| Total Revenue | $450,000 | 100% |
Direct Service Costs
| Line | Annual | % of Revenue |
|---|---|---|
| Teaching and aide wages | $198,000 | 44.0% |
| Payroll taxes on teaching staff | $19,800 | 4.4% |
| Food and kitchen supplies (gross) | $27,000 | 6.0% |
| Classroom supplies and curriculum | $9,000 | 2.0% |
| Total Direct Costs | $253,800 | 56.4% |
Gross Profit: $196,200 (43.6%)
Operating Expenses
| Line | Annual | % of Revenue |
|---|---|---|
| Director and administrative salary | $54,000 | 12.0% |
| Payroll taxes — admin staff | $5,400 | 1.2% |
| Employee benefits (health, retirement) | $18,000 | 4.0% |
| Rent and utilities | $67,500 | 15.0% |
| Liability and workers' comp insurance | $9,000 | 2.0% |
| Equipment and maintenance | $9,000 | 2.0% |
| Licensing and regulatory fees | $4,500 | 1.0% |
| Software and technology | $4,500 | 1.0% |
| Staff training | $4,500 | 1.0% |
| Marketing | $4,500 | 1.0% |
| Professional services | $6,300 | 1.4% |
| Total Operating Expenses | $187,200 | 41.6% |
Operating Income: $9,000 (2.0%)
This matches the thin-margin reality documented across multiple industry sources. The Federal Reserve Bank of Minneapolis has found that margins under 1% are common for independent centers; the 2% here reflects active CACFP participation and good occupancy. A center running at 70% occupancy instead of 85% on the same fixed cost structure would be at breakeven or operating at a loss.
Why Margins Are So Thin
The structural squeeze in childcare is unlike most service businesses. Two forces work against each other simultaneously:
From the top: Tuition is constrained by what families can afford. Even with subsidies, there's a ceiling on what the market will bear — especially when competing with home-based providers or subsidized programs. Raising prices risks losing enrollment, which makes the occupancy math worse.
From the bottom: Labor is the dominant cost, and state ratios mean you can't reduce staffing below legal minimums. If enrollment drops from 50 children to 40, revenue falls 20% but the infant and toddler classrooms still need the same number of teachers. The labor cost doesn't scale down proportionally.
The only reliable paths to margin improvement:
- Increase occupancy toward 85–90% capacity
- Optimize age group mix toward older children, where ratios are more favorable (10:1 for preschool vs. 4:1 for infants)
- Participate in CACFP to offset food costs with reimbursements
- Pursue state grants and quality incentives — many states offer per-employee grants for centers in quality improvement programs
- Build before/after school programming with older children at lower supervision requirements
Occupancy: The Critical Variable
Revenue in childcare is almost entirely fixed-rate per enrolled child. There's no surge pricing, no upsell, no volume discount. The only top-line lever is enrollment — how many slots are filled relative to licensed capacity.
The breakeven occupancy point for most centers is 70–75%. Below that, fixed costs exceed revenue. Above 85–90%, margins start to become meaningful.
New centers should plan for a slow ramp. Per Brightwheel's enrollment modeling, months 1–3 typically run at 20–30% capacity; it takes most centers 9–12 months to reach 85–95% occupancy. Underestimating this timeline is one of the most common financial mistakes in childcare business plans. To see what your center owns and owes as occupancy ramps, the daycare balance sheet tracks assets, liabilities, and equity at each point in time.
Reading the P&L Over Time
Three metrics matter most when tracking a daycare income statement month to month:
Enrollment rate. Total enrolled children divided by licensed capacity. Below 75% is a warning sign. Track this weekly, not monthly, because families give notice and leave faster than new families enroll.
Labor as a percentage of revenue. When enrollment dips, labor percentage rises — the same teachers cover fewer paying children. If labor climbs above 75% of revenue for more than two consecutive months, it signals a real margin problem developing.
Net CACFP position. Gross food expense minus CACFP reimbursements. Some operators don't track this clearly, which makes food cost look worse than it is and obscures the true benefit of program participation. A center receiving $18,000 in CACFP reimbursements against $27,000 in food costs has a net food cost of $9,000 (2% of revenue) — much more manageable than the gross figure suggests. Track all of these line items with the daycare expense tracker template.
For a pre-built version in Excel, the Daycare Income Statement Template includes tuition tracking by age group, CACFP reimbursement lines, and the full P&L structure above. If you're managing multiple financial documents, the Financial Planning templates cover the broader set of statements that childcare center owners and lenders typically need.
Last updated: March 24, 2026
Frequently Asked Questions
Related Articles
Coffee Shop Income Statement Example: Revenue, Costs, and Margins
A coffee shop income statement example with beverage cost benchmarks, labor targets, prime cost rules, and a worked P&L for an independent café doing $480K/year.
Food Truck Income Statement Example: Line Items and Benchmarks
A food truck income statement example with food cost benchmarks, unique line items like commissary and pitch fees, and a worked P&L for a single-truck operation.
Healthcare Income Statement Example: Revenue, Expenses, and Margins
A healthcare income statement example covering net patient revenue, contractual adjustments, expense benchmarks, and operating margin targets for providers.
Healthcare Pro Forma Example: What to Include and How to Build One
A practical healthcare pro forma example — covering revenue projections, payer mix, expense benchmarks, and a worked model for a new medical practice or service line.
Hotel Pro Forma Example: What to Include and How to Build One
A practical hotel pro forma example — covering RevPAR, GOP, undistributed expenses, FF&E reserves, and a worked model for acquisition or development underwriting.
Manufacturing Income Statement Example: Line Items and Benchmarks
A manufacturing income statement example with COGM schedule, gross margin benchmarks by subsector, and a worked P&L for a precision parts manufacturer.