Healthcare Balance Sheet Example: A Line-by-Line Breakdown
A complete healthcare balance sheet example for a medical practice — covers contractual adjustments, days in AR, malpractice reserves, and key financial ratios.
The feature that makes a healthcare balance sheet unlike any other isn't malpractice reserves or medical equipment. It's accounts receivable.
Every business has receivables. But healthcare receivables are unique in that the amount billed is almost never the amount collected. A practice bills $300 for an office visit; the insurance contract pays $140; the patient owes a $30 copay. The $130 gap — the contractual adjustment — has to be stripped out of AR before the balance sheet reflects anything meaningful. Layer in denials, underpayments, and patients who never pay their portion, and managing AR becomes the central financial challenge of running any healthcare practice.
That's where most of the distinctive accounting mechanics in healthcare originate: the net AR presentation, the allowance for doubtful accounts, the days-in-AR metric, the third-party settlement estimates. Understanding these isn't just bookkeeping — it's how a practice owner reads the financial health of their business.
What Makes Healthcare Different on a Balance Sheet
Every balance sheet covers assets, liabilities, and equity. The equation is always Assets = Liabilities + Equity. But in healthcare, the content of those sections differs significantly from almost every other industry.
Patient AR is presented net of contractual adjustments. The gross amount billed to payers bears little relationship to what will actually be collected. Under U.S. GAAP, patient accounts receivable is shown on the balance sheet after subtracting both the allowance for contractual adjustments (amounts the practice contracted away) and the allowance for doubtful accounts (amounts billed but expected to go uncollected). What remains is the net collectible balance.
Days in AR is the single most-watched metric. Unlike a retailer tracking inventory turns or a manufacturer watching WIP balances, healthcare practices live and die by how fast they collect receivables. This metric connects directly to the healthcare income statement, where net patient revenue reflects what's actually collected. The HFMA benchmark is 30–40 days; MGMA considers 35 days or under top-tier performance. Above 50 days typically indicates a billing or collections problem.
Malpractice liability sits on the balance sheet. Any practice that self-insures — or carries a claims-made policy — must accrue a reserve for claims that occurred during the coverage period but haven't been reported yet. These IBNR (Incurred But Not Reported) reserves are real liabilities that external reviewers scrutinize during financing and acquisition processes.
Third-party payer settlements create balance sheet uncertainty. Practices and hospitals participating in Medicare and Medicaid file annual cost reports that take one to three years to finalize. Until they do, estimated settlement amounts appear either as a current liability (if the practice may owe money back) or a current asset (if an underpayment is expected).
Medical equipment can be a major asset. For practices with imaging, surgical, or diagnostic equipment — ultrasound machines, digital X-ray systems, infusion pumps, procedure lasers — the fixed asset schedule can be substantial. The ratio of accumulated depreciation to gross equipment value indicates how old the asset base is and when replacement spending is coming.
The Three Sections: What Goes Where
Assets
Current assets — expected to convert to cash within 12 months:
- Cash and cash equivalents — Operating accounts and short-term deposits. Practices should maintain at least 30–60 days of operating expenses in cash; practices with significant equipment debt or capital needs carry more.
- Patient accounts receivable (net) — The gross AR balance, reduced by the allowance for contractual adjustments and the allowance for doubtful accounts. This is what the practice realistically expects to collect. Gross AR is not reported separately on most practice balance sheets — the net figure is what matters.
- Medical and office supplies — Medications, injection supplies, disposables, and office supplies on hand. Smaller and more stable than manufacturing inventory because healthcare supplies turn quickly and most are consumed as services are delivered.
- Prepaid expenses — Prepaid malpractice insurance premiums, prepaid rent, and vendor deposits paid in advance.
Long-term assets — assets not expected to convert to cash within 12 months:
- Medical equipment (gross) — Diagnostic and treatment equipment: exam tables, ECG machines, ultrasound units, imaging equipment, procedure instruments. Larger practices may carry significant capital equipment balances. Depreciated over 5–10 years depending on asset type.
- Computer and health IT systems — EHR software (if capitalized under ASC 350-40), practice management systems, and hardware. Many practices treat IT costs as operating expenses; capitalized amounts depend on whether the software meets the application development stage criteria.
- Office furniture and fixtures — Waiting room furniture, reception desks, exam room furniture.
- Leasehold improvements — Built-out exam rooms, procedure suites, reception areas. Amortized over the shorter of the lease term or useful life.
- Less: accumulated depreciation — Total depreciation recognized to date on all depreciable assets. Net PP&E = gross PP&E minus accumulated depreciation.
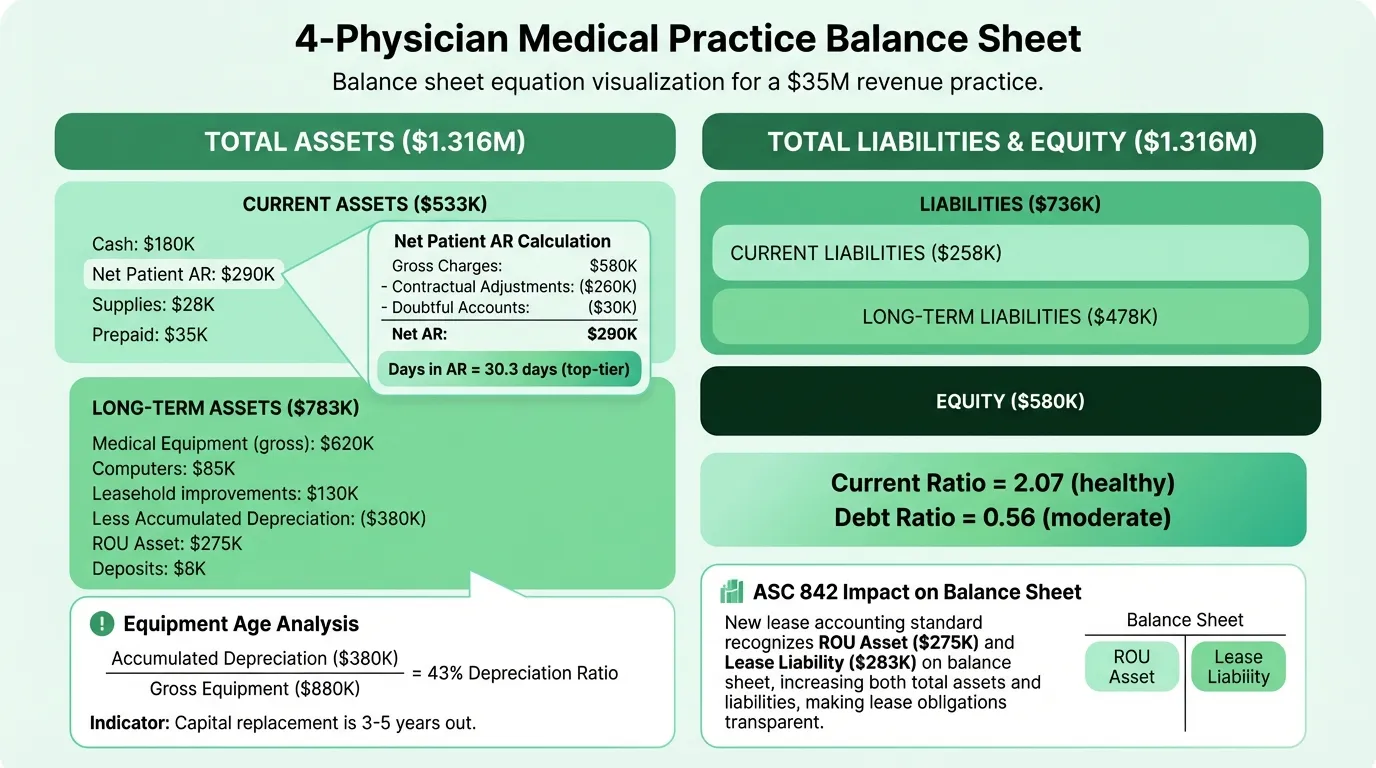
- Right-of-use (ROU) asset — Under ASC 842, any operating lease longer than 12 months must be recognized as an asset on the balance sheet. For most practices with long-term clinic leases, this is one of the larger line items.
- Security deposits — Lease deposits held by landlords, typically refundable at lease end.
Liabilities
Current liabilities — due within 12 months:
- Accounts payable — Unpaid invoices for medical supplies, lab services, contracted services, and vendor bills.
- Accrued wages and salaries — Payroll earned by clinical and administrative staff not yet paid as of the balance sheet date. Includes accrued PTO in jurisdictions where it must be carried as a liability.
- Current portion of long-term debt — Equipment loan and term loan principal due in the next 12 months.
- Estimated third-party payer settlements — Current-period Medicare/Medicaid cost report adjustments expected to be settled within 12 months. Appears as a liability if the practice has been overpaid; as a current asset if underpaid.
- Current portion of operating lease liability — Lease payments due within the next 12 months under ASC 842.
Long-term liabilities:
- Equipment loans (long-term portion) — Principal due beyond 12 months on financing for medical equipment, imaging systems, and other capital assets.
- Professional liability reserve (malpractice) — Accrued reserve for IBNR claims under self-insured or claims-made malpractice arrangements. For most small practices carrying commercial occurrence-based coverage, this line may be zero or minimal; it grows as practices self-insure or as tail liability becomes a factor.
- Operating lease liability (long-term) — The non-current portion of the practice's lease obligations under ASC 842.
Equity
For a physician-owned partnership or professional corporation:
- Partners' capital / paid-in capital — The cumulative investment made by the physician owners.
- Retained earnings — Accumulated net income minus distributions to owners. Most private practices distribute profits regularly, so retained earnings balances are often modest relative to revenue.
For a nonprofit or health system: equity is replaced by net assets, broken into unrestricted, temporarily restricted, and permanently restricted categories.
Complete Example: Multi-Physician Outpatient Practice
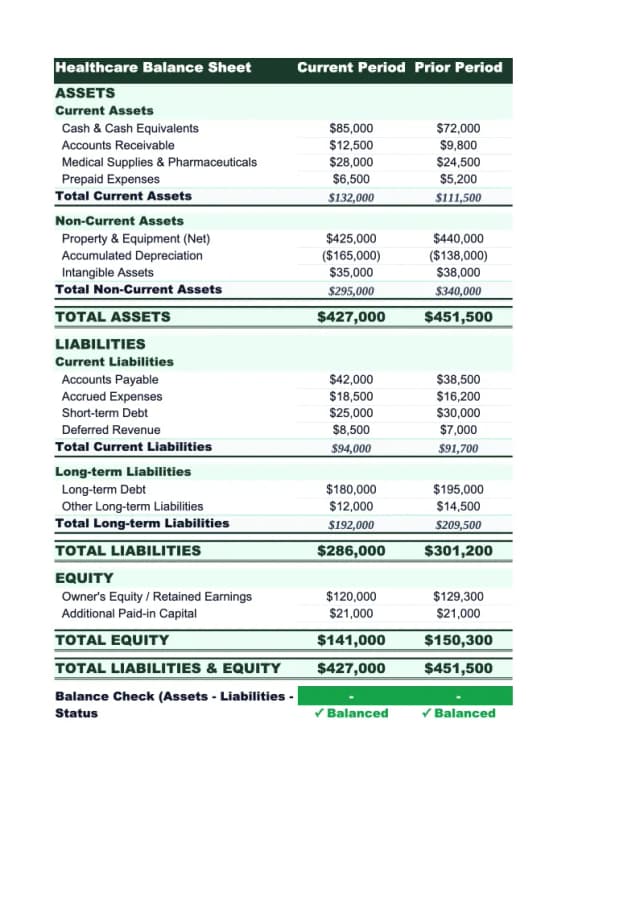
Here's a representative balance sheet for a four-physician outpatient practice doing approximately $3.5 million in annual net revenue:
Assets
Current Assets
| Line Item | Amount |
|---|---|
| Cash and cash equivalents | $180,000 |
| Patient accounts receivable, net | $290,000 |
| Medical and office supplies | $28,000 |
| Prepaid expenses | $35,000 |
| Total Current Assets | $533,000 |
Long-Term Assets
| Line Item | Amount |
|---|---|
| Medical equipment (gross) | $620,000 |
| Computers and health IT | $85,000 |
| Office furniture and fixtures | $45,000 |
| Leasehold improvements | $130,000 |
| Less: accumulated depreciation | ($380,000) |
| Right-of-use asset (clinic lease) | $275,000 |
| Security deposits | $8,000 |
| Total Long-Term Assets | $783,000 |
Total Assets: $1,316,000
Liabilities
Current Liabilities
| Line Item | Amount |
|---|---|
| Accounts payable | $45,000 |
| Accrued wages and salaries | $78,000 |
| Current portion of equipment loans | $42,000 |
| Estimated third-party payer settlements | $28,000 |
| Current portion of operating lease | $65,000 |
| Total Current Liabilities | $258,000 |
Long-Term Liabilities
| Line Item | Amount |
|---|---|
| Equipment loans (long-term) | $165,000 |
| Professional liability reserve | $95,000 |
| Operating lease liability (long-term) | $218,000 |
| Total Long-Term Liabilities | $478,000 |
Total Liabilities: $736,000
Equity
| Line Item | Amount |
|---|---|
| Partners' capital | $320,000 |
| Retained earnings | $260,000 |
| Total Equity | $580,000 |
Total Liabilities + Equity: $1,316,000
What the Numbers Actually Mean
Current Ratio
Current Ratio = Current Assets / Current Liabilities
In this example: $533,000 / $258,000 = 2.07
The target range for medical practices is 1.5–2.0 or better. A ratio above 2.0 is healthy; a ratio below 1.0 means current liabilities exceed current assets — a genuine liquidity problem. The AAFP recommends medical practices target above 2:1. Note that the current operating lease liability ($65,000) is included in current liabilities under ASC 842, which pulls this ratio down compared to pre-2019 financials that didn't capitalize leases.
Days in Accounts Receivable
Days in AR = (Net Patient AR / Net Annual Revenue) × 365
In this example: ($290,000 / $3,500,000) × 365 = 30.3 days
This is top-tier performance. MGMA benchmarks place best performers below 35 days; the median practice runs 40–45 days. The number tells you how long, on average, it takes to collect after a service is delivered. A rising days-in-AR figure is one of the first signals that billing operations are breaking down — whether from increased denials, staffing gaps in the billing department, payer contract issues, or deteriorating patient collections.
Practices with AR over 90 days should be no more than 12–15% of total AR per MGMA standards. Any balance sitting beyond 120 days has substantially reduced collectibility.
Debt Ratio
Debt Ratio = Total Liabilities / Total Assets
In this example: $736,000 / $1,316,000 = 0.56
This is moderate. The AAFP notes that banks generally prefer a debt-to-equity ratio below 3:1 for medical practices — in this example, $736,000 / $580,000 = 1.27, well within range. The operating lease liabilities (required under ASC 842) add meaningfully to both total liabilities and total assets compared to older balance sheets; practices should account for this when tracking debt ratios over time.
Need a ready-made balance sheet template for your healthcare?
Download a pre-built spreadsheet with industry-specific categories, formulas, and formatting.
The AR Section Under a Microscope
Patient accounts receivable is the balance sheet line that deserves the most attention. The net AR figure hides significant complexity:
| Layer | What It Represents |
|---|---|
| Gross patient charges | Total billed at chargemaster or fee schedule rates |
| Less: contractual adjustments | Amounts the practice agreed to write off per payer contracts |
| Less: allowance for doubtful accounts | Estimated amount of patient responsibility expected to go uncollected |
| = Net patient AR | What actually appears on the balance sheet |
The key distinction: contractual adjustments are not bad debt. They represent amounts the practice was never contractually entitled to collect — they exist because payers negotiate discounts from billed charges. Bad debt is amounts billed to patients (their copays, deductibles, or self-pay balances) that the practice tried and failed to collect.
A practice with a net collection rate below 95% (per MGMA benchmarks) is leaving collectible revenue on the table. That gap shows up as a growing AR balance and a slowing days-in-AR metric before it shows up anywhere on the income statement. You can check these against your actual margins using our healthcare profit margin calculator.
Equipment Age and Capital Replacement Planning
The accumulated depreciation percentage — accumulated depreciation divided by gross PP&E — tells you how old your equipment base is.
In this example:
- Gross depreciable assets (excluding ROU asset and deposits): $880,000
- Accumulated depreciation: $380,000
- Depreciation ratio: 43%
A ratio of 30–50% is typical for a practice with a mixed-age equipment base. When this ratio climbs above 70–80%, it signals that much of the equipment is nearing end of useful life — and significant capital spending is coming. Lenders and acquirers examine this closely because aging equipment creates capital expenditure obligations that don't appear on the income statement until the purchases are made.
For practices with diagnostic imaging, the replacement cost can be substantial. An MRI machine costs $1.5–3M; digital X-ray systems run $100–300K; ultrasound units $30–150K. Tracking depreciation ratios by asset class helps anticipate these conversations before they become urgent. A healthcare pro forma can model the financial impact of major equipment replacements over a 3–5 year horizon.
What Lenders and Buyers Look At
When a practice applies for equipment financing, a practice acquisition loan, or a line of credit, lenders and buyers review the balance sheet for the same signals:
| What They Check | What They Want to See |
|---|---|
| Current ratio | Above 1.5; preferably 2.0 or better |
| Days in AR | Below 40; top performers below 35 |
| AR over 90 days | No more than 12–15% of total AR |
| Net collection rate | 96–97% or better |
| Debt-to-equity ratio | Below 3:1 per AAFP guidance |
| Malpractice reserve | Adequately funded; tail coverage addressed |
| Third-party settlement estimates | Consistent year-over-year; no large unexpected swings |
| ROU asset / lease liability | Term and renewal options understood |
| Equipment depreciation ratio | Below 70%; anything higher flags upcoming capex |
In acquisition transactions, the malpractice reserve deserves particular scrutiny. Practices with claims-made policies have potential tail liability — the cost to cover claims arising from services rendered before the policy lapses — that may not appear on the balance sheet at all if the practice hasn't accrued for it. Tail coverage typically costs two to three times the annual malpractice premium. For a structured starting point, see our healthcare financial model template.
Using the Balance Sheet Monthly
Most practice managers review revenue, collections, and overhead ratios monthly. Fewer review the balance sheet on the same cadence — which is where slow-moving problems hide.
Check these each month:
- Days in AR trend — Is it rising? If so, is it a specific payer, a specific claim type, or a billing staff gap?
- AR over 90 days as a percentage — Rising past the 12–15% benchmark means collections are falling behind.
- Cash balance relative to monthly expenses — Are you maintaining 30+ days of operating expenses in cash?
- Estimated third-party settlements — Is the balance growing? A consistently increasing liability here may indicate cost reporting issues that need attention before the audit.
- Accrued wages — Growing faster than headcount? Verify nothing is building up that will create an unexpected cash demand.
The Healthcare Balance Sheet Template is structured for this monthly review, with the net AR presentation, malpractice reserve tracking, and key ratio calculations built in. For a complete financial picture, it works alongside the Healthcare Income Statement Template — which covers net patient revenue, contractual adjustments, and operating expenses — and the Healthcare Cash Flow Template, which shows whether collections are keeping pace with obligations.
The balance sheet and income statement answer different questions. The income statement tells you whether the practice was profitable last month. The balance sheet tells you whether the practice is financially sound — whether AR is being collected, whether obligations are funded, and whether the asset base can sustain the business. In healthcare, those are often very different answers.
Last updated: March 24, 2026
Frequently Asked Questions
Related Articles
Church Accounting Best Practices: A Practical Guide
How church accounting works — fund accounting, restricted funds, internal controls, financial reports, and the tax rules that catch churches off guard.
Church Balance Sheet Example: A Line-by-Line Breakdown
A complete church balance sheet example with real line items, fund accounting explained, and the benchmarks church boards use to assess financial health.
Construction Accounting: A Practical Guide for Contractors
Construction accounting is different from standard accounting. This guide covers job costing, WIP schedules, retainage, revenue recognition methods, and common mistakes.
Construction Balance Sheet Example: A Line-by-Line Breakdown
A complete construction company balance sheet example with real line items, WIP accounting, retainage, overbilling, and what sureties and lenders look for.
Daycare Balance Sheet Example: Line by Line
A complete daycare balance sheet example with real line items — enrollment deposits, playground equipment, subsidy receivables, and what the numbers mean.
Food Truck Balance Sheet Example: A Line-by-Line Breakdown
A complete food truck balance sheet example with real line items, truck depreciation rules, and what makes a food truck's financials different from a restaurant.