Church Balance Sheet Example: A Line-by-Line Breakdown
A complete church balance sheet example with real line items, fund accounting explained, and the benchmarks church boards use to assess financial health.
A church balance sheet is a snapshot of what the congregation owns, owes, and has set aside for specific purposes. It looks similar to any nonprofit Statement of Financial Position — but the layer underneath it, fund accounting, makes it work differently from what most people expect.
Understanding how the two layers fit together is what separates churches that manage their finances well from those that accidentally spend restricted funds on operations.
Statement of Financial Position vs. Fund Accounting
Churches produce two related financial documents that address different questions:
The Statement of Financial Position (GAAP balance sheet) asks: what does the organization own, what does it owe, and what is the cumulative net position? This is what goes to the bank, the auditor, and Form 990.
The Fund Accounting Report asks: how much is in each designated fund — General, Building, Benevolence, Missions? This is what the board and congregation need to verify that donor-restricted money is being handled correctly.
The Statement of Financial Position consolidates everything. Fund accounting breaks it apart. Both are necessary. The GAAP statement satisfies external requirements; the fund report satisfies internal accountability to donors.
The most important rule in church finance connects the two: restricted fund balances cannot be used to cover operating shortfalls, even temporarily. Using building fund cash to make payroll, then "replacing it later," violates donor intent — regardless of whether the pastor's salary was technically paid. This is the mistake that creates the most church finance problems.
How a Church Balance Sheet Differs from Other Nonprofits
The structure is identical — Assets = Liabilities + Net Assets — but church-specific assets and liabilities create a distinct set of line items.
Unique assets churches typically carry:
- Parsonage or manse — a residence owned by the church and provided to the pastor. It appears on the balance sheet at original cost minus accumulated depreciation. A parsonage purchased 30 years ago for $90,000 may have a book value close to zero while being worth $400,000 at market. The balance sheet shows the book value, not market value.
- Musical instruments — organs, pianos, sound systems. Often fully depreciated (net book value of zero) but still in active use. The balance sheet understates their replacement cost.
- Church building and land — land is never depreciated; the building is depreciated over approximately 40 years. A church with a 25-year-old building may show substantial accumulated depreciation.
- Pews and furnishings — fully depreciated after their useful life, often showing at zero on the balance sheet while requiring significant replacement capital.
Unique liabilities:
- Mortgage on the church building or parsonage — the most significant liability for the 42% of churches that carry debt
- Deferred revenue — advance payments for facility rentals, retreat registrations, and conference fees; recorded as a liability until the event occurs
- Security deposits held from organizations renting the facility
Unique net asset categories:
- Building Fund — restricted to construction, renovation, or major facility improvements
- Benevolence Fund — restricted to assisting individuals and families in need; cannot be redirected to operations
- Missions Fund — restricted to missionary support and outreach activities
- Memorial Fund — gifts given in memory of deceased members, typically restricted by donor intent
- Endowment — permanently restricted; only investment income may be spent
Complete Church Balance Sheet Example
Here is a representative Statement of Financial Position for a mid-size church with approximately $1.2M in annual contributions, an owned facility, and a parsonage:
Assets
Current Assets
| Line Item | Amount |
|---|---|
| Checking account (general fund) | $68,000 |
| Savings / money market | $95,000 |
| Undeposited offerings | $4,200 |
| Pledges receivable (current, net of allowance) | $32,000 |
| Prepaid expenses | $11,500 |
| Total Current Assets | $210,700 |
Fixed Assets
| Line Item | Amount |
|---|---|
| Land (church campus) | $180,000 |
| Church building | $1,240,000 |
| Parsonage | $145,000 |
| Furniture and furnishings | $88,000 |
| Musical instruments and sound system | $62,000 |
| Vehicles | $34,000 |
| Office and technology equipment | $28,000 |
| Less: accumulated depreciation | ($485,000) |
| Total Fixed Assets (net) | $1,292,000 |
Other Assets
| Line Item | Amount |
|---|---|
| Long-term investments (endowment) | $215,000 |
| Cash surrender value — life insurance | $18,000 |
| Total Other Assets | $233,000 |
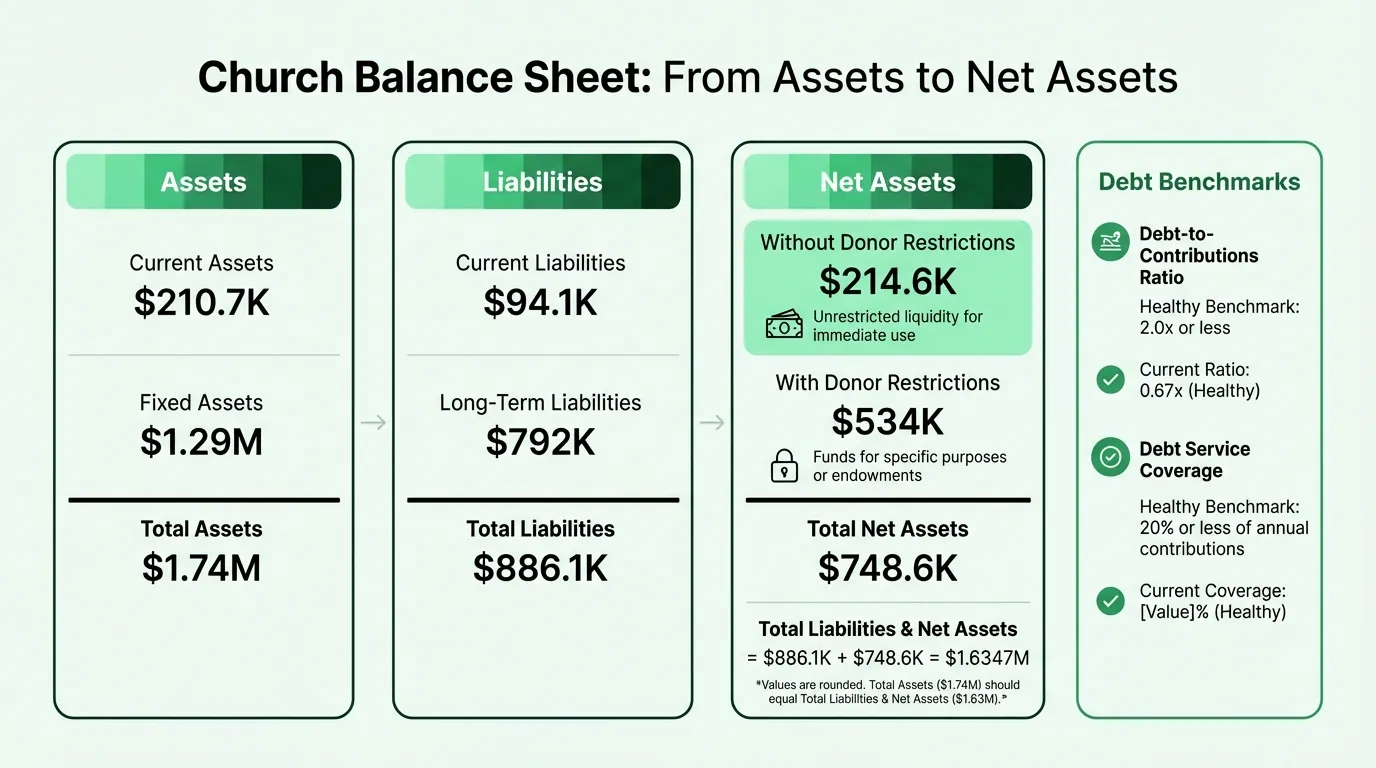
Total Assets: $1,735,700
Liabilities
Current Liabilities
| Line Item | Amount |
|---|---|
| Accounts payable | $14,200 |
| Accrued wages and salaries | $22,000 |
| Payroll taxes payable | $8,400 |
| Deferred revenue (facility rentals, events) | $9,500 |
| Security deposits held | $3,600 |
| Current portion of mortgage — church building | $28,000 |
| Current portion of mortgage — parsonage | $8,400 |
| Total Current Liabilities | $94,100 |
Long-Term Liabilities
| Line Item | Amount |
|---|---|
| Mortgage payable — church building (long-term) | $680,000 |
| Mortgage payable — parsonage (long-term) | $112,000 |
| Total Long-Term Liabilities | $792,000 |
Total Liabilities: $886,100
Net Assets
| Line Item | Amount |
|---|---|
| Without donor restrictions | |
| General fund (undesignated) | $124,600 |
| Board-designated operating reserve | $90,000 |
| Total Without Donor Restrictions | $214,600 |
| With donor restrictions | |
| Building fund | $185,000 |
| Benevolence fund | $28,000 |
| Missions fund | $42,000 |
| Memorial fund | $35,000 |
| Endowment (permanent) | $215,000 |
| Other purpose-restricted funds | $29,000 |
| Total With Donor Restrictions | $534,000 |
| Total Net Assets | $748,600 |
Total Liabilities and Net Assets: $1,634,700
Note: The $101,000 difference between total assets and total liabilities + net assets reflects that this is a simplified illustrative example. In a real balance sheet, the equation must balance exactly.
Need a ready-made balance sheet template for your church?
Download a pre-built spreadsheet with industry-specific categories, formulas, and formatting.
Reading the Numbers: What Boards Should Check
Unrestricted Liquidity
The total net assets figure — $748,600 — sounds substantial. But most of it is not available for operations.
The endowment ($215,000) is permanently restricted. The building and benevolence and missions funds ($285,000 combined) are restricted for specific purposes. What's available for operations without donor permission is the $214,600 in net assets without donor restrictions.
Of that, $90,000 is board-designated as an operating reserve (which the board set aside — it can be released, but not without a board decision). The truly undesignated general fund balance is $124,600.
This church has roughly 5-6 weeks of unrestricted operating cash relative to its annual budget. That's below the 13-week target recommended by CapinCrouse, and below the 22-week average reported by churches surveyed in the Christian Standard's 2024 church finance study. Run your own numbers with the church cash flow calculator to see where your reserves stand.
Debt Benchmarks
Churches have specific debt benchmarks that matter more than generic ratios. According to CapinCrouse:
| Metric | Formula | Healthy | Red Flag |
|---|---|---|---|
| Debt-to-contributions | Total debt ÷ Annual unrestricted contributions | 2.0x or less | Above 3.0x |
| Debt service coverage | Annual debt payments ÷ Annual contributions | 20% or less | Above 20% |
For this church, with $808,400 in total debt (current + long-term) and $1.2M in annual contributions:
- Debt-to-contributions: $808,400 ÷ $1,200,000 = 0.67x — well within healthy range
- Assuming combined annual mortgage payments of $145,000: Debt service: $145,000 ÷ $1,200,000 = 12.1% — healthy
Research on church growth suggests that churches with a debt-to-giving ratio below 2.9x had the best attendance growth and ministry outcomes. Above 3.0x, debt service obligations tend to crowd out programming and staff investment.
The Current Ratio
Current Ratio = Current Assets / Current Liabilities
In this example: $210,700 / $94,100 = 2.24
Unlike restaurants (where a ratio below 1.0 is normal), churches should maintain a current ratio above 1.0 — ideally above 2.0. Churches don't have the high-frequency, predictable cash inflows that let restaurants operate with negative working capital. Giving varies week to week, by season, and by circumstances in the congregation.
Restricted Fund Balance Integrity
Each restricted fund balance must reconcile to actual cash or investments held for that purpose. A benevolence fund showing $28,000 should correspond to $28,000 held in a designated account or earmarked within the general account — not money that has already been spent.
This is where the fund accounting report matters. The GAAP balance sheet shows the aggregate; the fund report verifies that the aggregate is actually sitting where it's supposed to be. For a broader look at fund accounting controls and segregation of duties, see our church accounting best practices guide.
The Parsonage: A Balance Sheet Complication
If the church owns a parsonage, the balance sheet gets complicated in a specific way.
The parsonage appears at original cost minus depreciation — historical book value. A parsonage purchased in 1992 for $145,000 will show a book value close to zero after 30+ years of depreciation, while the actual property might be worth $380,000 today. This understates the real assets of the church.
Two practical implications:
- Insurance. The balance sheet value is not the replacement cost. Make sure the parsonage is insured for actual replacement value, not book value.
- Equity conversations. When the board discusses the church's financial position, the parsonage equity (market value minus mortgage) may be a significant source of strength that the balance sheet obscures. A separate schedule of estimated market values is useful for strategic planning, even if it doesn't appear on the formal financial statement.
What Auditors and Denominational Bodies Look For
If your church undergoes an audit — or submits financials to a denominational body — reviewers focus on:
Net asset classification accuracy. Are restricted funds correctly classified? Have any restricted funds been inadvertently spent on general operations?
Deferred revenue vs. contributions. Advance event registrations are liabilities, not income, until the event occurs. Misclassifying deferred revenue as contributions inflates reported income.
Depreciation. Many smaller churches skip depreciation internally. GAAP-compliant audited statements require it. The absence of depreciation overstates net assets and understates the true cost of operating aging facilities. Tracking depreciation alongside your church income statement ensures your expense reporting stays complete.
Internal controls. Financial duties should be separated so that no single person handles all steps from receiving offerings to reconciling bank accounts. Auditors look for evidence of review — dual signatures on checks, regular bank reconciliations reviewed by someone other than the bookkeeper.
Form 990 compliance. Tax-exempt churches with gross receipts above $200,000 or assets above $500,000 file Form 990, which is publicly available. The balance sheet appears as Part X. A 990 that shows declining unrestricted net assets, growing restricted liabilities, or large unexplained asset movements will draw scrutiny from denominational bodies and major donors.
Putting It to Work
A church balance sheet reviewed once a year at the annual meeting is largely decorative. The value comes from monthly review at the finance committee level.
The specific checks that matter each month:
- Unrestricted cash trend — is it growing or shrinking? A multi-month decline in unrestricted cash is a signal before it becomes a crisis
- Fund balance integrity — do the restricted balances reflect what was given and spent, not just a running total?
- Mortgage balance — is principal declining as expected? What is the current payoff position?
- Deferred revenue — are advance payments for upcoming events properly classified?
- Expense tracking — use a church expense tracker to catch discrepancies before they reach the balance sheet
The Church Balance Sheet Template is structured for this monthly review, with both the GAAP-format Statement of Financial Position and a fund balance summary that matches the way most church finance teams actually track money. For a complete financial picture, it pairs with the Church Budget Template to track planned versus actual spending and the Church Income Statement Template to see how contributions and expenses moved during the period.
The balance sheet shows where you stand. The budget shows where you planned to be. The income statement shows how you got here. Together, they're the minimum set for responsible stewardship.
Last updated: March 24, 2026
Frequently Asked Questions
Related Articles
Church Accounting Best Practices: A Practical Guide
How church accounting works — fund accounting, restricted funds, internal controls, financial reports, and the tax rules that catch churches off guard.
Construction Accounting: A Practical Guide for Contractors
Construction accounting is different from standard accounting. This guide covers job costing, WIP schedules, retainage, revenue recognition methods, and common mistakes.
Construction Balance Sheet Example: A Line-by-Line Breakdown
A complete construction company balance sheet example with real line items, WIP accounting, retainage, overbilling, and what sureties and lenders look for.
Daycare Balance Sheet Example: Line by Line
A complete daycare balance sheet example with real line items — enrollment deposits, playground equipment, subsidy receivables, and what the numbers mean.
Food Truck Balance Sheet Example: A Line-by-Line Breakdown
A complete food truck balance sheet example with real line items, truck depreciation rules, and what makes a food truck's financials different from a restaurant.
Healthcare Balance Sheet Example: A Line-by-Line Breakdown
A complete healthcare balance sheet example for a medical practice — covers contractual adjustments, days in AR, malpractice reserves, and key financial ratios.