Hotel Budget Example: Departments, Benchmarks, and Real Numbers
A practical hotel budget example covering the USALI department structure, labor benchmarks, GOP targets, and the line items independent hoteliers most often miss.
Hotel budgeting runs on a different framework than most other industries. The Uniform System of Accounts for the Lodging Industry (USALI) organizes revenue and expenses by department rather than by function — and understanding that structure is the starting point for any meaningful hotel budget.
This post covers what goes into a hotel budget, the benchmarks to set targets against, and a worked example for a mid-size independent property.
The USALI Framework: Why Hotels Budget by Department
The USALI framework has been the hotel industry standard since 1926 (now in its 11th edition). It structures the P&L into three tiers:
Operated departments — departments that generate both revenue and direct expenses:
- Rooms
- Food & Beverage (broken into sub-departments: restaurant, bar, banquets, room service)
- Spa, golf, retail, or other operated revenue centers
Undistributed operating expenses — overhead shared across the hotel:
- Administrative & General (A&G)
- Sales & Marketing
- Information & Telecommunications Systems (IT)
- Property Operations & Maintenance (POM)
- Utilities
Non-operating and fixed charges — costs below the GOP line:
- Management fees
- Property taxes
- Insurance
- FF&E reserve (capital replacement reserve)
The USALI structure lets you compare your numbers against STR and CBRE benchmarks on an apples-to-apples basis. If you're not organizing your budget this way, you're working blind on the industry benchmarks that matter most.
Revenue Projections: Starting with the Right Metrics
Room revenue drives most hotel budgets. The three metrics to project first:
- Occupancy rate — rooms sold ÷ rooms available
- ADR (Average Daily Rate) — room revenue ÷ rooms sold
- RevPAR (Revenue Per Available Room) — occupancy × ADR
According to STR data cited by the American Hotel & Lodging Association, 2025 national benchmarks average 63.4% occupancy, $162.16 ADR, and $102.78 RevPAR. Those numbers vary significantly by market and segment:
| Segment | Occupancy | ADR | RevPAR |
|---|---|---|---|
| Upscale full-service | 67–72% | $180–$225 | $120–$155 |
| Midscale | 58–64% | $110–$140 | $70–$89 |
| Economy | 52–58% | $80–$110 | $44–$63 |
| Upscale lifestyle/boutique | 69–70% | $186–$193 | $130+ |
Use your prior-year actuals as the baseline. If you're projecting a rate increase, tie it to a specific rationale — comp set pricing data, a renovation, a market event — not just an optimistic assumption.
Build monthly projections, not just an annual number. Hotels see 25–40% seasonal variation between peak and trough months, and an annual budget averaged across 12 equal months will be wrong every month. The hotel sales forecast example covers how to build the monthly revenue projections that feed into these budget lines.
The Rooms Department Budget
The Rooms department is the most profitable department in nearly every hotel. Revenue comes directly from room sales; direct expenses are modest relative to that revenue.
Rooms department expenses typically include:
- Front desk labor (check-in/out, reservations, night audit)
- Housekeeping labor (room attendants, inspectors, housepersons, laundry)
- Guest supplies (amenities, toiletries, in-room coffee)
- Linen and uniforms
- Cleaning supplies and operating supplies
- Contract services (deep cleaning, pest control)
- OTA and travel agent commissions
- Franchise reservation fees (if branded)
OTA commissions deserve a dedicated budget line. Independent hotels typically pay 15–25% per booking through Booking.com or Expedia. If OTAs generate 40% of your room revenue, that commission load significantly reduces your effective ADR. Budget it explicitly and track direct booking conversions as a cost-reduction lever.
Housekeeping cost per occupied room (CPOR) varies sharply by property type. According to HotelData.com's 2024 data:
- Select-service properties: $28.28 CPOR
- Full-service properties: $57.59 CPOR
- Resorts: $123.60 CPOR
These differences reflect staffing ratios, service standards, and checkout turnover times. Use your historical CPOR to build room labor budget — multiply by projected occupied room nights. Run your property's numbers through the hotel break-even calculator to find the occupancy level where room revenue covers all direct costs.
Food & Beverage Budget
F&B runs at lower margins than rooms. According to CoStar/STR data, F&B labor alone accounts for 59.4% of total F&B expenses, with cost of goods sold (food and beverage product) at 24.0%.
The standard F&B cost targets:
- Food cost: 28–35% of food revenue
- Beverage cost: 18–25% of beverage revenue
- Combined F&B labor: 45–55% of F&B revenue
F&B labor grew approximately 15% in 2024 — the fastest-growing cost line across hotel departments according to CoStar/STR. Budget this realistically; don't use pre-2022 labor benchmarks.
Hotels without significant F&B operations (limited-service properties) skip this section or include only complimentary breakfast costs under Rooms.
Undistributed Expenses
These are the overhead costs that don't live inside a specific revenue department.
Administrative & General
Covers the general manager, accounting, HR, security, and any professional services (legal, audit). Budget A&G at 6–9% of total revenue for most independent hotels.
Sales & Marketing
Includes sales team salaries, digital advertising, OTA marketing programs, PR, and collateral. Track sales team commissions alongside your revenue targets with Carvd. According to HospitalityNet, most hotels currently spend under 2.5% of room revenue on marketing — below the recommended 4–6% for properties actively trying to grow occupancy.
Property Operations & Maintenance (POM)
Engineering labor, preventive maintenance contracts, HVAC, plumbing, electrical, building supplies. This line often gets squeezed in tight budget years, which accelerates physical depreciation.
Utilities
Electricity, natural gas, water, sewer, waste removal. Energy runs approximately 6% of total operating costs for most hotel properties. Utilities increased only 2.0% in 2024 according to CBRE — relative relief compared to labor and insurance.
Insurance
Insurance premiums surged 17.4% in 2024 per CBRE Hotels Research. Budget for continued increases rather than using prior-year actuals. Property and casualty coverage, general liability, and employment practices all belong here. Track these rising costs alongside all other line items with the Hotel Expense Tracker Template.
Need a ready-made budget template for your hotel?
Download a pre-built spreadsheet with industry-specific categories, formulas, and formatting.
Fixed Charges (Below the GOP Line)
These costs come after Gross Operating Profit is calculated:
| Fixed Charge | Typical Range |
|---|---|
| Management fees | 2–4% of total revenue |
| Property taxes | 3–6% of total revenue (highly location-dependent) |
| Insurance | 1–2% of total revenue |
| FF&E reserve | 3–5% of total revenue |
The FF&E reserve is the most commonly underbudgeted fixed charge for independent hotels. It's a capital replacement reserve for furniture, fixtures, and equipment — mattresses, flooring, lobby furniture, HVAC units. Branded hotels often require 4–5% by franchise agreement. Budget at least 3%, even if you currently have no capital replacement projects planned.
Example: Independent Full-Service Hotel Budget
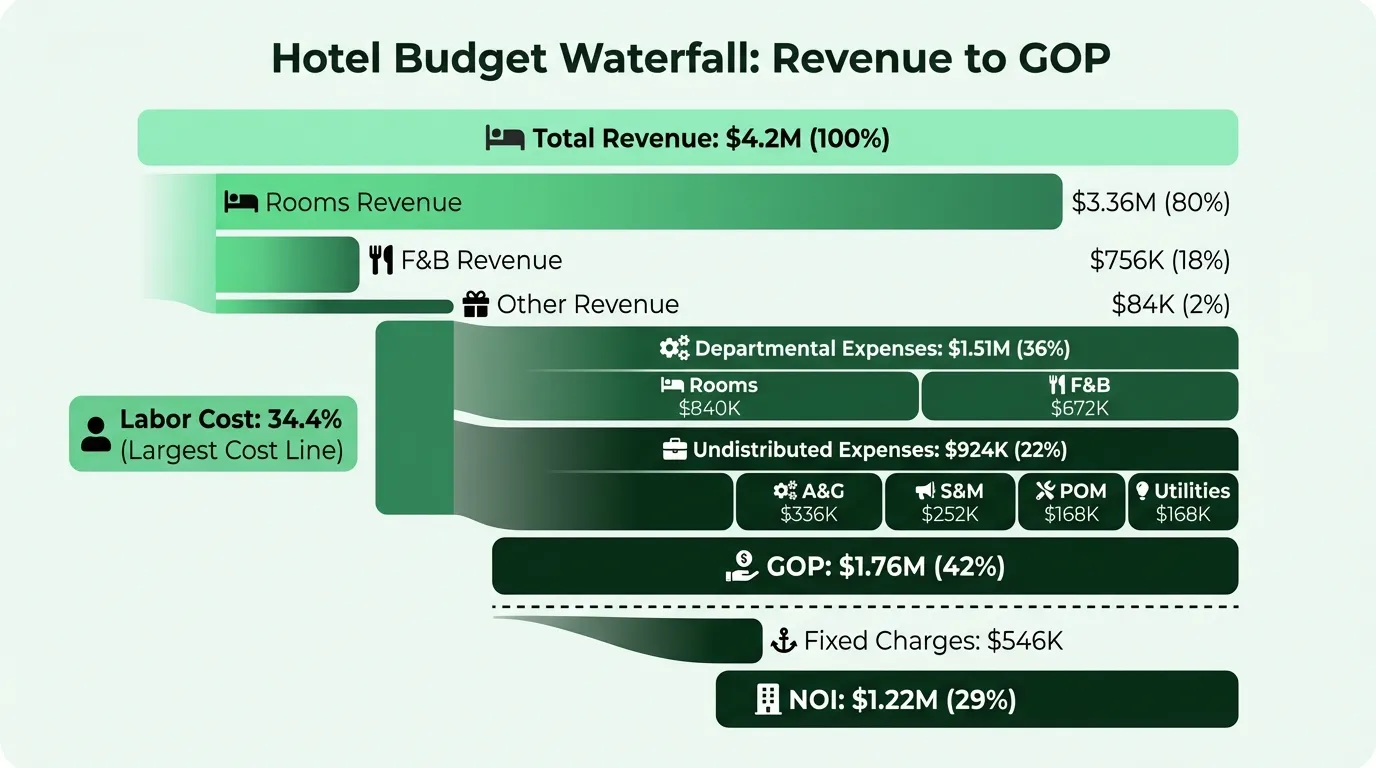
Here's a realistic annual budget for a 100-room independent full-service hotel targeting $4.2M in total revenue:
Revenue
| Department | Annual Revenue | % of Total |
|---|---|---|
| Rooms | $3,360,000 | 80% |
| Food & Beverage | $756,000 | 18% |
| Other (parking, spa, retail) | $84,000 | 2% |
| Total Revenue | $4,200,000 |
Rooms revenue assumes 68% occupancy × $135 ADR × 365 days × 100 rooms
Departmental Expenses
| Category | Amount | % of Total Revenue |
|---|---|---|
| Rooms labor (housekeeping, front desk) | $604,800 | 14.4% |
| Rooms direct expenses (supplies, commissions) | $235,200 | 5.6% |
| Rooms Dept. Total | $840,000 | 20% |
| F&B labor | $415,800 | 9.9% |
| F&B cost of goods sold | $181,440 | 4.3% |
| F&B other direct expenses | $75,600 | 1.8% |
| F&B Dept. Total | $672,840 | 16.0% |
Undistributed Operating Expenses
| Category | Amount | % of Total Revenue |
|---|---|---|
| Administrative & General | $294,000 | 7.0% |
| Sales & Marketing | $168,000 | 4.0% |
| Property Operations & Maintenance | $210,000 | 5.0% |
| Utilities | $252,000 | 6.0% |
| Undistributed Total | $924,000 | 22.0% |
Gross Operating Profit
| Amount | % of Revenue | |
|---|---|---|
| Total Revenue | $4,200,000 | 100% |
| Total Dept. + Undistributed Expenses | $2,436,840 | 58.0% |
| Gross Operating Profit (GOP) | $1,763,160 | 42.0% |
Fixed Charges
| Category | Amount | % of Revenue |
|---|---|---|
| Management fees (3%) | $126,000 | 3.0% |
| Property taxes | $210,000 | 5.0% |
| Insurance | $63,000 | 1.5% |
| FF&E reserve (3.5%) | $147,000 | 3.5% |
| Total Fixed Charges | $546,000 | 13.0% |
Net Operating Income: $1,217,160 (29.0% of revenue)
This example runs above the industry average GOP of 37–38% because the rooms revenue mix is high and F&B is modest. Actual NOI will vary based on debt service and depreciation, which are property-specific. The net profit margin after those charges typically falls to 4–7% of total revenue per industry benchmarks from Canary Technologies. For a line-by-line view of how this translates to a monthly P&L, see the hotel income statement example.
Labor: The Line Item That Will Define Your Budget Year
CBRE Hotels Research reported that hotel labor costs reached 34.4% of revenue in 2024, up from approximately 31% pre-pandemic. Compensation has risen 22.1% since 2019 while hours worked have actually fallen 7.4% — reflecting wage inflation, not just more staff.
For independent hotels, this means:
- Budget labor at current market wages, not last year's rates
- Don't assume hours can be further reduced without service impact — most hotels have already cut to minimum viable staffing
- Build wage increases into monthly projections, especially in markets with scheduled minimum wage increases
The Hotel Budget Template includes monthly labor line items broken down by department, so you can track CPOR and labor-to-revenue ratios automatically as you enter actuals.
What Goes Wrong in Hotel Budgets
Projecting occupancy from last year's peak, not average. A strong summer or holiday season can distort the baseline. Use trailing 12-month averages adjusted for known market changes, not your best three months.
Not budgeting for OTA commission explicitly. If you're netting OTA revenue after fees, that's fine — just be consistent. If you're grossing up room revenue and forgetting to add the commission expense line, you're overstating profitability by 15–25% of OTA-sourced revenue.
Underbudgeting the FF&E reserve. A property that runs its FF&E reserve at 1–2% will look more profitable on paper — until guest review scores drop and occupancy follows. Build 3–5% in, every year.
Using a single annual budget without monthly distribution. Hotels have genuine seasonality. A January that looks like a disaster against a flat monthly target may actually be right on track for January. Build the monthly distribution into the budget itself.
Not connecting budget to RevPAR. Labor and housekeeping costs flex with occupied room nights. If RevPAR comes in 10% below budget, your variable costs should come in lower too. A budget that tracks revenue only at the total level misses the connection between volume and cost.
The Monthly Budget Review
A hotel budget reviewed once at year-end is a filing exercise. The routine that produces value:
- Pull the prior month's departmental P&L
- Compare revenue to budget by department — rooms, F&B, other
- Check GOP against budget, and identify which department drove the variance
- Review labor cost % by department (rooms and F&B separately)
- Flag any undistributed expense category more than 10% over budget
For independent hotels without a management company to produce these reports, the Hotel Budget Template structures the monthly review with budget-vs-actual comparisons built in. If you also want to model revenue scenarios — what happens to GOP if occupancy drops 5 points — that connects to hotel cash flow planning for the weekly operational view.
GOP is the number that tells you whether the hotel is operating well. Net income tells you whether the capital structure is working. Track both.
Last updated: March 23, 2026
Frequently Asked Questions
Related Articles
Coffee Shop Budget Example: Real Numbers and Benchmarks
A practical coffee shop budget example with real cost benchmarks — covering beverage COGS, labor, rent, equipment maintenance, and the line items most operators underestimate.
Church Budget Example: Categories, Percentages, and What to Include
A practical church budget example with real percentages for staff, facilities, missions, and programs — plus the line items most churches overlook.
Construction Budget Example: Line Items, Percentages, and What to Include
A practical construction budget example covering hard costs, soft costs, overhead allocation, and the line items most contractors underestimate.
Daycare Budget Example: Categories, Benchmarks, and What to Watch
A practical daycare budget example covering revenue sources, expense ratios, occupancy thresholds, and the line items that determine whether a center stays financially viable.
Event Planning Budget Example: Real Numbers for Your Business
A practical event planning budget example covering agency overhead, per-event costs, revenue models, and the benchmarks every planner needs to protect margins.
What Is a Good Landscaping Budget? Benchmarks and Examples
A landscaping business budget breakdown covering labor, materials, equipment, overhead benchmarks, and the margin targets that separate profitable companies from struggling ones.