Hotel Cash Flow Template
See exactly when cash hits your account — room revenue, OTA settlements, F&B receipts, and payroll obligations — with a cash flow template built for hotel operators.
What's Inside This Hotel Cash Flow Template
This template includes 5 worksheets, each designed for a specific part of your hotel financial workflow:
Weekly Cash Flow
A 13-week rolling cash flow projection broken down by week — the right planning horizon for hotel operators managing seasonal occupancy swings and advance booking patterns.
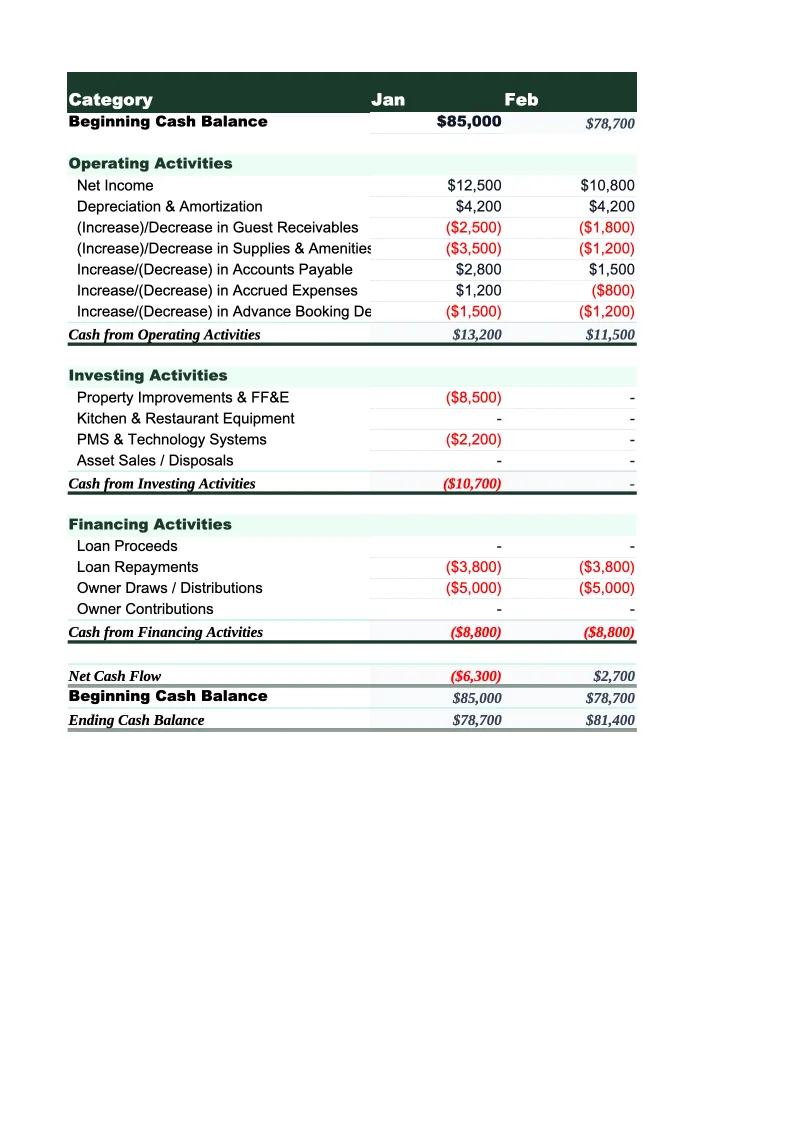
Monthly Cash Flow
A 12-month view of cash inflows and outflows organized by operating, investing, and financing activities.
Occupancy & Revenue Planner
A planning sheet where you enter monthly occupancy projections and average daily rate (ADR) assumptions, then see the cash impact rolled forward through the year.
OTA & Channel Settlement Tracker
A tracker for the complex settlement timing specific to hotel distribution channels.
Dashboard
A single-page visual summary showing current cash balance, 13-week runway, weekly cash flow trend, occupancy-linked revenue projection, and a breakdown of cash outflows by category (labor, OTA commissions, franchise fees, debt service, and other).
Hotel Cash Flow Template Features
- 13-week rolling cash flow with hotel-specific line items (room revenue by channel, OTA settlements, payroll, franchise fees)
- Monthly cash flow statement formatted for lender and franchise system review
- Occupancy and ADR planner with monthly revenue projections and cash timing
- OTA channel settlement tracker showing expected inflow timing by distribution source
- Credit card settlement lag and OTA net-remittance timing built into cash receipt calculations
- Visual dashboard with 13-week runway and occupancy-driven revenue forecast
How to Use This Hotel Cash Flow Spreadsheet
Start with the Weekly Cash Flow sheet. Download the file, open it in Excel or Google Sheets, and enter your current bank balance in the starting cash cell. Then fill in your expected cash inflows for the next 13 weeks: projected weekly room revenue by channel, estimated F&B and ancillary income, and any group deposits you expect to receive. Use your last 4-8 weeks of PMS (property management system) reports as a baseline — most hotel managers complete the inflow side in about 25 minutes. Then fill in the outflow side using your accounts payable schedule, payroll run dates, and fixed cost calendar.
Set up the OTA & Channel Settlement Tracker with your current channel mix — what percentage of revenue comes from direct bookings, Booking.com, Expedia, corporate accounts, and other sources. Enter each channel's typical settlement timing. Once set up, this sheet feeds settlement timing into the Weekly Cash Flow sheet automatically and shows you when OTA remittances will actually arrive. Pay particular attention to periods after high-occupancy months: the cash from a full October doesn't arrive from OTAs until mid-to-late November, which can create a misleading picture if you're only looking at occupancy and ADR.
15 minutes from download to your first cash flow projection
Download the template, enter your current balance and forward booking pace, and see your hotel's 13-week cash position — OTA settlement timing included.
Why Every Hotel Needs a Cash Flow Template
Hotels face a cash flow problem that most other businesses don't: the timing gap between when guests check in and when you actually receive the money. Direct bookings and walk-ins settle within a few days. But OTA-sourced reservations — which account for 30-60% of room nights at most independent and franchise properties — net-settle 30-45 days after checkout. A fully booked October looks great on your PMS dashboard, but if 50% of that revenue flows through OTAs, the cash doesn't arrive until late November or December. Add a franchise royalty payment due on the 15th, a quarterly property tax bill, and a FF&E replacement that can't wait, and a profitable month can still produce a cash shortfall.
The cash dynamics that matter most in hotels are occupancy-driven but not occupancy-correlated in real time. Your labor costs — the largest cash outflow category at 30-40% of revenue for most full-service properties — run on a weekly payroll cycle regardless of how last week's occupancy looked. Housekeeping hours scale with rooms cleaned, but front desk, maintenance, and management labor are relatively fixed. Franchise fees, typically 5-10% of room revenue, are due monthly based on the prior month's performance, adding a one-month lag to a cost that's already occupancy-variable. Understanding these timing relationships is what separates hotels that manage cash proactively from those that are perpetually surprised by the gap between their RevPAR report and their bank balance.
Hotel Industry at a Glance
Financial templates built for hotels and hospitality businesses — from independent properties to branded franchises. Pre-loaded with room revenue, F&B, and event billing categories.
Revenue Drivers
- Room revenue (ADR × occupancy)
- Food & beverage
- Meeting & event space
- Spa & wellness
- Parking & ancillary fees
Key Cost Categories
- Labor (rooms, F&B, front office)
- Cost of F&B sold
- OTA & marketing commissions
- Utilities & property maintenance
- Franchise & management fees
- Administrative overhead
Typical Margins
Gross: 65-80% · Net: 10-20%
Seasonality
Business hotels peak weekdays and Q1/Q3; leisure properties peak summer and holidays. January is typically slowest for both segments.
Key Performance Indicators
Hotel Cash Flow Template FAQ
More Hotel Templates
Hotel Balance Sheet Template for Excel
$29
Hotel Budget Template for Excel
$29
Hotel Business Plan Template for Excel
$39
Hotel Expense Tracker Template for Excel
$29
Hotel Financial Model Template for Excel
$29
Hotel Income Statement Template for Excel
$29
Hotel Invoice Template for Excel
$29
Hotel KPI Dashboard Template for Excel
$29
Hotel P&L Template for Excel
$29
Hotel Pro Forma Template for Excel
$29
Hotel Project Budget Template for Excel
$29
Hotel Sales Forecast Template for Excel
$29
Hotel Valuation Template for Excel
$29
Hotel Cash Flow Template
$29