What Is a Good Landscaping Budget? Benchmarks and Examples
A landscaping business budget breakdown covering labor, materials, equipment, overhead benchmarks, and the margin targets that separate profitable companies from struggling ones.
A landscaping business that charges $125/hour for a crew still loses money if it doesn't know what that crew actually costs to run.
The landscaping industry is straightforward in theory — you provide a service, you charge for it, what's left is profit. In practice, the gap between revenue and actual profit gets eaten by underestimated labor burden, misallocated overhead, equipment that costs more than budgeted, and seasonal cash flow that punishes anyone who plans with annual averages.
According to the National Association of Landscape Professionals (NALP), the U.S. landscaping industry reached $188.8 billion in 2025, with roughly 692,000 companies and 1.4 million workers. The average company is small — and the financial management practices that separate the profitable 40% from the struggling 60% are mostly budgeting habits.
Here's what a good landscaping budget actually looks like.
The Cost Structure: Where Revenue Goes
Every landscaping budget separates costs into two layers: direct costs (what it costs to do the job) and overhead (what it costs to run the business). The ratio between them determines your gross margin, and gross margin determines whether the business is viable.
Direct Costs (Cost of Revenue)
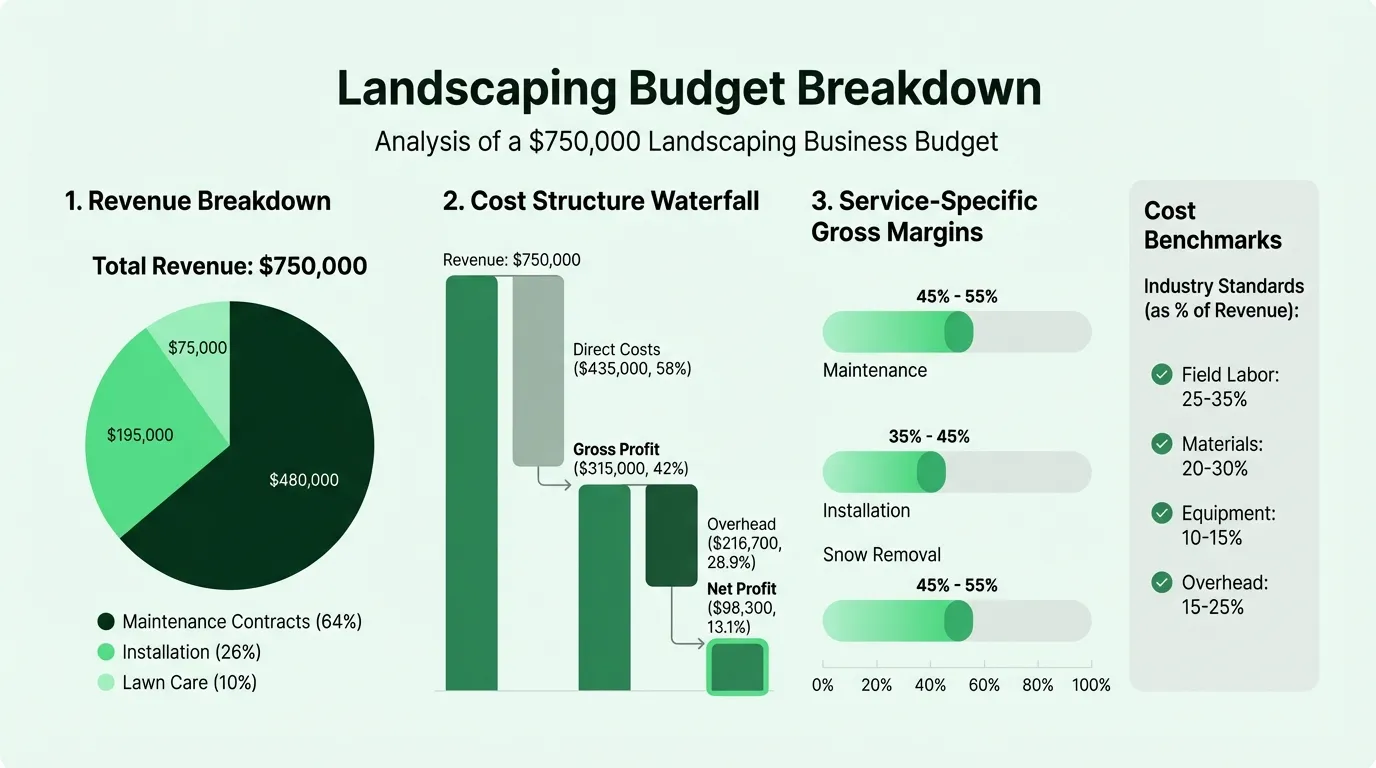
Field labor: 25–35% of revenue
This is the largest cost line in most landscaping operations, and the most commonly underestimated. The common mistake: budgeting wages without the labor burden.
A crew member earning $20/hour costs approximately $26/hour loaded, once you add payroll taxes (FICA, FUTA, SUTA), workers' compensation insurance, and benefits. The labor burden multiplier is roughly 25–35% on top of base wages. A company paying $18/hour base with four crew members running 40 hours/week is spending about $93,600 in wages per year — but the true loaded cost is closer to $120,000.
Labor above 50% of revenue consistently signals one of three problems: routes are too scattered (too much drive time, too few jobs per day), pricing doesn't reflect actual crew cost, or crews are overstaffed for their workload.
Materials and supplies: 20–30% of revenue
For maintenance-focused companies — mowing, pruning, fertilization, irrigation — materials run at the lower end: 15–20% of revenue. Design/build and hardscaping companies sit at the higher end: 25–35%, driven by plant material, mulch, stone, concrete, and specialty supplies.
Materials costs should be tracked job by job, not just as a company-wide total. When materials for a specific project come in 15% over estimate, the job was underpriced — and you need to know that before you quote the next similar project. Our landscaping pricing guide covers how to calculate the right markup on materials to protect your margins.
Equipment: 10–15% of revenue
Equipment costs include fuel, scheduled maintenance, repairs, and depreciation. A commercial mower costs $3,000–$8,000 and typically lasts 3–5 years with proper maintenance. A work truck runs $15,000–$25,000 used and lasts 7–10 years. Equipment trailer: $2,000–$4,000.
The budgeting trap: treating equipment as a one-time purchase and ignoring replacement cost. A realistic budget includes an annual equipment replacement reserve — typically 10–15% of current equipment value per year — as a line item in operating expenses. If you skip this, you'll eventually face a $20,000 emergency truck replacement with no cash saved for it.
Subcontractors: variable
Many landscaping companies subcontract specialized work — tree removal, irrigation installation, concrete work, snow plowing overflow. Budget these job-specifically and track the margin on subcontracted work separately. Subcontracted jobs often carry lower gross margins than self-performed work.
Overhead (Operating Expenses)
Overhead should run 15–25% of revenue for established landscaping companies. Smaller operations under $1M in revenue often see overhead at 30–40% because fixed costs don't scale down — the insurance, the truck, the storage unit all cost roughly the same whether you're doing $400,000 or $800,000 in revenue.
| Overhead Category | Typical Annual Cost |
|---|---|
| Office/warehouse rent or storage | $6,000–$24,000 |
| General liability insurance | $550–$610 |
| Workers' compensation insurance | $1,700–$2,000 |
| Commercial auto insurance (per vehicle) | $2,400–$2,500 |
| Tools and equipment insurance | $450–$500 |
| Equipment maintenance and repairs | $5,000–$10,000 |
| Marketing and advertising | $12,000–$60,000 |
| Field management software | $1,800–$6,000 |
| Admin and office salaries | varies |
| Professional services (accounting, legal) | $2,000–$5,000 |
| Fuel (overhead portion) | varies |
Insurance figures based on 2026 rates from Insureon and MoneyGeek for small landscaping businesses.
The overhead line that surprises most operators: admin and indirect labor. A two-person office team managing scheduling, estimates, invoicing, and customer service adds $80,000–$120,000 in annual labor cost before a single lawn gets mowed. Budget it explicitly. Companies that omit admin labor from overhead consistently underestimate what it actually costs to run the business.
Gross Margin Targets by Service Type
Gross margin is what's left after direct costs — before overhead, before your salary, before taxes. It's the number that has to cover everything else.
| Service Type | Target Gross Margin |
|---|---|
| Maintenance contracts (mowing, pruning) | 45–55% |
| Lawn care (fertilization, weed control) | 45–55% |
| Irrigation installation and service | 45–55% |
| Residential installation | 35–45% |
| Design/build projects | 35–50% |
| Commercial installation | 25–35% |
| Snow removal | 45–55% |
Maintenance-focused businesses consistently outperform design/build on gross margin. Recurring contracts have predictable crew scheduling, dense routes, and no material cost variability. A mowing-only company can run at 50%+ gross margin with efficient routing. A company that does primarily custom hardscaping installations faces more material price volatility, more subcontracting, and longer sales cycles.
The practical test: calculate your gross margin separately for each service division. Most operators who do this for the first time discover that one division is profitable and another isn't. The blended margin hides the problem. Run these numbers quickly with the landscaping profit margin calculator.
Net Profit Margin Targets
After overhead, what should be left for profit?
- Start-up / year one: 3–5% — covering fixed costs while building the client base
- Growing company (2–4 years): 10–15% — systems are working, route density is improving
- Established, optimized: 15–20% — recurring clients, efficient crews, minimal customer turnover
The industry average net margin hovers around 10%. Consistently below that usually points to one of three issues: underpriced accounts, labor inefficiency, or overhead that hasn't scaled with revenue. Consistently above 20% is achievable but requires intentional route planning, pricing discipline, and low client churn.
Crew Productivity as a Budget Input
One of the most useful planning tools for a landscaping budget is crew productivity benchmarks — how much revenue should each crew generate?
- Two-person maintenance crew: $150,000–$200,000 in annual revenue
- Three-person maintenance crew: ~$33,000/month in season
- Revenue per employee (industry average): ~$123,000/year (NALP)
- Revenue per employee (companies over $10M): ~$156,000/year (NALP)
If a two-person crew generates less than $100,000/year, the accounts are underpriced, the routes are inefficient (too much drive time between jobs), or both. Use the landscaping break-even calculator to find the revenue threshold each crew needs to hit.
Route density matters more than most operators realize. Scattered routes — where drive time between jobs eats 30–40% of the workday — can cost 4–6 jobs per crew per day compared to tight, geographically dense routes. At $50–$150 per account visit, that's $200–$900 in lost daily revenue per crew. It shows up in labor as a percentage of revenue, not as a visible line item.
Need a ready-made budget template for your landscaping?
Download a pre-built spreadsheet with industry-specific categories, formulas, and formatting.
Example Budget: $750,000 Landscaping Business
Here's a realistic annual budget for a landscaping company doing $750,000 in revenue — primarily maintenance contracts with some installation work.
Revenue
| Service Type | Revenue | % of Total |
|---|---|---|
| Maintenance contracts | $480,000 | 64% |
| Installation and enhancements | $195,000 | 26% |
| Lawn care (fertilization, weed control) | $75,000 | 10% |
| Total Revenue | $750,000 |
Direct Costs
| Category | Amount | % of Revenue |
|---|---|---|
| Field labor (loaded: wages + 30% burden) | $225,000 | 30% |
| Materials and supplies | $150,000 | 20% |
| Equipment fuel and operating costs | $37,500 | 5% |
| Subcontractors | $22,500 | 3% |
| Total Direct Costs | $435,000 | 58% |
| Gross Profit | $315,000 | 42% |
Overhead (Operating Expenses)
| Category | Amount | % of Revenue |
|---|---|---|
| Admin salary (office manager, part-time) | $55,000 | 7.3% |
| Owner/operator salary (market rate) | $75,000 | 10% |
| Insurance (GL, workers' comp, auto) | $12,000 | 1.6% |
| Equipment maintenance and replacement reserve | $18,000 | 2.4% |
| Vehicle maintenance (3 trucks) | $9,000 | 1.2% |
| Marketing and advertising | $22,500 | 3% |
| Software (CRM, scheduling, invoicing) | $3,600 | 0.5% |
| Office/storage rent | $9,600 | 1.3% |
| Professional services | $4,500 | 0.6% |
| Contingency (1%) | $7,500 | 1% |
| Total Overhead | $216,700 | 28.9% |
| Net Pre-Tax Profit | $98,300 | 13.1% |
This produces a 13.1% net margin — healthy for a growing company. The owner salary is separated from profit intentionally: it represents market-rate compensation for working in the business, distinct from the return on owning the business.
Apply your own numbers with the Landscaping Budget Template, which structures this cost hierarchy by month and separates direct costs from overhead automatically.
Seasonality: The Hardest Part to Budget
For most landscaping companies outside the Sun Belt, revenue is concentrated in a 7–8 month window. A company doing $750,000 annually might collect 80–85% of that between April and October, and almost nothing between November and March.
The costs that don't stop in winter:
- Vehicle payments and insurance
- Equipment storage and maintenance
- Admin salaries
- Warehouse/storage rent
- Software subscriptions
The fatal budgeting mistake: dividing annual revenue by 12 and planning each month at the average. February at $7,500 in revenue against $18,000 in fixed costs isn't a budget problem — it's planned cash burn. You need 3–4 months of reserves going into winter to cover it.
The fix: build a month-by-month budget that reflects actual revenue distribution. Use your prior year's monthly billing as the base. Revenue in January and February is often 5–10% of what June or July generates. Budget the fixed costs flat across all 12 months, and the gap between revenue and costs in winter months tells you exactly how large your cash reserve needs to be.
Snow removal contracts are one way to offset the seasonal gap — they turn a negative-cash-flow month into a neutral or mildly positive one. If you operate in a climate where snow is reliable, budget winter service revenue separately and treat it as its own division with its own direct costs.
Common Landscaping Budgeting Mistakes
Not loading labor costs. Budgeting wages without the 25–35% burden multiplier causes every job estimate to be off. A crew that costs $18/hour in wages costs $23–$24/hour loaded. Over a year with four crew members, that's a $50,000 gap between what you budgeted and what you spent.
Skipping the equipment reserve. Equipment depreciates. Budget for replacement before it fails. A $5,000 annual reserve accumulates the cash for the next truck or mower without putting the business in emergency mode.
Averaging revenue across 12 months. Seasonal businesses need a month-by-month cash flow plan, not an annual average. The average is irrelevant when three of your twelve months are cash-negative. Model the monthly gaps with the landscaping cash flow template.
Not tracking margin by service type. A blended 42% gross margin across maintenance and installation hides the fact that installation might be running at 28% while maintenance runs at 55%. Without division-level margin tracking, you can't make informed decisions about where to grow.
Underallocating overhead to jobs. Every service job has to contribute to overhead recovery. If your total overhead is $216,000 on $750,000 in revenue, every revenue dollar needs to carry $0.29 toward overhead, plus cover its direct costs, plus generate profit. Jobs priced to cover only direct labor and materials leave overhead unrecovered.
The Landscaping Budget Template structures the full cost hierarchy — direct costs, overhead, and monthly seasonality — so you can see where every dollar goes before the season starts. If you're also tracking cash week by week through the slow season, the budget templates section includes formats for other service industries that follow the same seasonal cash flow structure.
The One Number to Check Monthly
Track your gross margin by service division every month. Compare actual against budget. When a division's gross margin drops, find out why before the next billing cycle — it's almost always labor (more hours than estimated), materials (price increase or waste), or route inefficiency (more drive time than planned).
Landscaping is a business where the margin is made or lost in the field, one crew and one account at a time. A budget that connects field-level cost to financial outcome gives you the visibility to fix problems before they compound through the season.
Last updated: March 23, 2026
Frequently Asked Questions
Related Articles
Coffee Shop Budget Example: Real Numbers and Benchmarks
A practical coffee shop budget example with real cost benchmarks — covering beverage COGS, labor, rent, equipment maintenance, and the line items most operators underestimate.
Church Budget Example: Categories, Percentages, and What to Include
A practical church budget example with real percentages for staff, facilities, missions, and programs — plus the line items most churches overlook.
Construction Budget Example: Line Items, Percentages, and What to Include
A practical construction budget example covering hard costs, soft costs, overhead allocation, and the line items most contractors underestimate.
Daycare Budget Example: Categories, Benchmarks, and What to Watch
A practical daycare budget example covering revenue sources, expense ratios, occupancy thresholds, and the line items that determine whether a center stays financially viable.
Event Planning Budget Example: Real Numbers for Your Business
A practical event planning budget example covering agency overhead, per-event costs, revenue models, and the benchmarks every planner needs to protect margins.
Hotel Budget Example: Departments, Benchmarks, and Real Numbers
A practical hotel budget example covering the USALI department structure, labor benchmarks, GOP targets, and the line items independent hoteliers most often miss.