Church Budget Example: Categories, Percentages, and What to Include
A practical church budget example with real percentages for staff, facilities, missions, and programs — plus the line items most churches overlook.
The median U.S. congregation had income of approximately $165,000 in 2023, according to Lifeway Research — but that figure masks enormous variation. A church with 50 regular attenders typically runs on about $66,000 per year. One with 250 attenders runs closer to $700,000. A congregation of 1,000+ may be managing $2.5 million or more.
What stays relatively consistent across those sizes is the underlying structure: where the money comes from, where it goes, and the percentage benchmarks that separate financially healthy churches from those operating on the edge.
This is what a church budget actually looks like.
Where Church Revenue Comes From
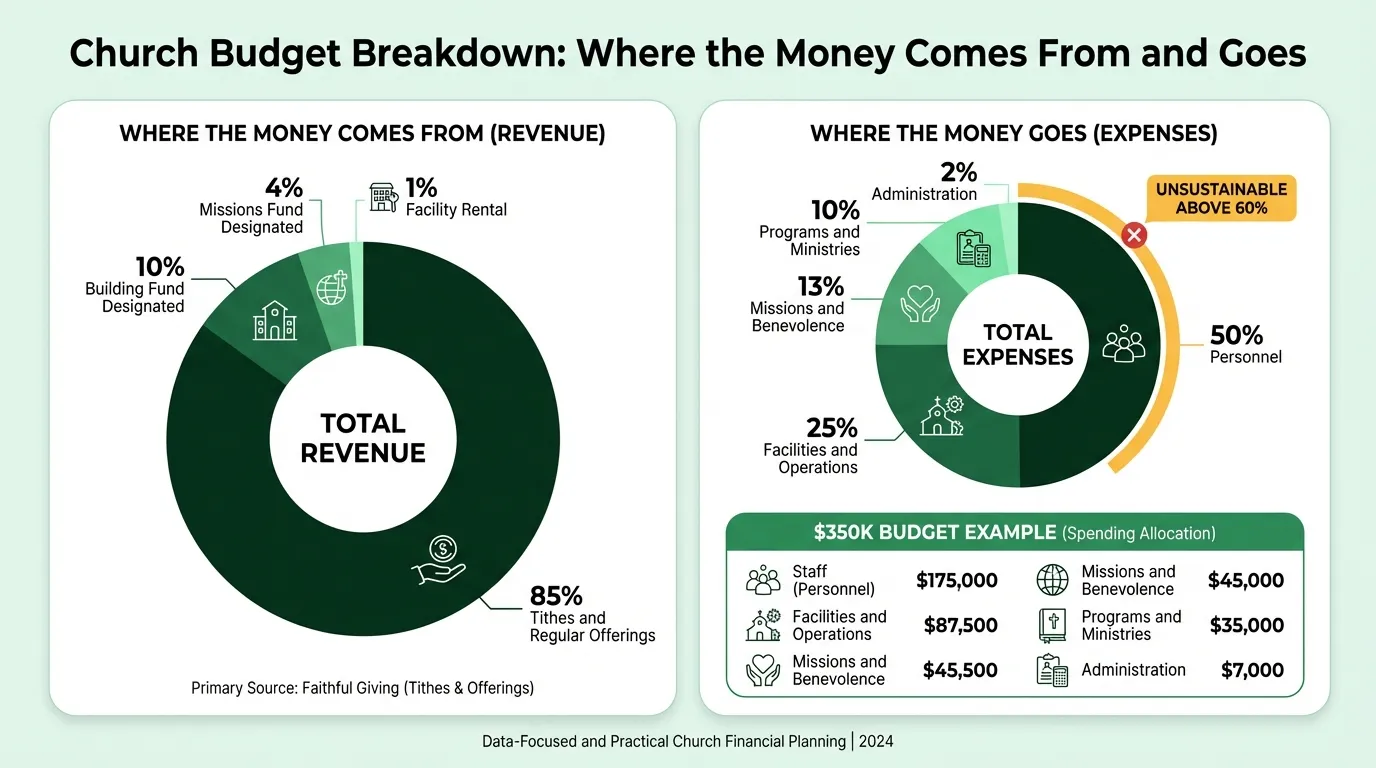
The Faith Communities Today 2020 study of 15,278 congregations across 80+ denominations found that 85% of church income comes from participant contributions — tithes and regular offerings. Everything else is secondary.
| Revenue Source | % of Total Income |
|---|---|
| Tithes and regular offerings | 85% |
| Fundraising events | 4% |
| Facility rental income | 4% |
| Endowments | 1% |
| Investments | 1% |
| School tuition | 1% |
| Other | 4% |
This concentration in a single revenue source is both a strength and a vulnerability. Income is predictable week to week, but it's tied directly to attendance and congregational giving culture. A church with 100 committed givers has more revenue stability than one with 300 inconsistent attenders.
Common revenue line items in a church budget:
- General fund offerings (weekly tithes)
- Building fund / capital campaign designated giving
- Missions fund designated giving
- Special offerings (Christmas, Easter, Lenten)
- Benevolence fund contributions
- Facility rental income (weddings, community events, outside groups)
- Interest and investment income
- Fundraising events (net proceeds)
- School tuition (if the church operates a school or preschool)
- Memorial and legacy gifts
One practical note: giving drops 14–25% in summer months and spikes sharply in December. A church that divides its annual budget by 12 and expects equal monthly income will find itself cash-short every summer. Build seasonality into your monthly cash flow projections, not just the annual total. Understanding how these seasonal shifts affect your overall financial position starts with a clear church balance sheet.
The Four Expense Categories
Church expenses organize naturally into four functions: personnel, facilities, missions and benevolence, and programs. The FACT 2020 data provides the clearest cross-denominational picture of how churches actually allocate spending:
| Category | % of Total Budget |
|---|---|
| Staff salaries and benefits | 43% |
| Buildings and operations | 26% |
| Missions and benevolence | 13% |
| Programs and discipleship | 11% |
| Other | 7% |
These are medians across all congregation sizes. Personnel spending is higher at mid-size churches (54% for congregations of 100–249 adults) and lower at large churches (46% for 1,000+ adults), where economies of scale allow more programming with proportionally fewer staff.
Example: A $350,000 Church Budget
Here's a realistic example for a church with 150–200 regular attenders and $350,000 in annual income:
Revenue
| Source | Amount | % of Total |
|---|---|---|
| Weekly tithes and offerings | $280,000 | 80% |
| Building fund designated giving | $35,000 | 10% |
| Missions fund designated giving | $14,000 | 4% |
| Facility rental income | $14,000 | 4% |
| Fundraising and special events | $7,000 | 2% |
| Total Revenue | $350,000 |
Expenses by Category
| Category | Amount | % of Total |
|---|---|---|
| Personnel (salaries and benefits) | $175,000 | 50% |
| Facilities and operations | $87,500 | 25% |
| Missions and benevolence | $45,500 | 13% |
| Programs and ministries | $35,000 | 10% |
| Administration | $7,000 | 2% |
| Total Expenses | $350,000 |
Operating reserve contribution: This example breaks even, but best practice is to budget a $15,000–$25,000 surplus to build reserves toward the 3–6 month target. That surplus comes from either growing income or reducing discretionary expenses — not from spending every dollar the church receives.
Personnel Detail
| Line Item | Amount |
|---|---|
| Senior pastor salary | $70,000 |
| Senior pastor housing allowance | $18,000 |
| Associate/youth pastor | $45,000 |
| Administrative assistant | $28,000 |
| Payroll taxes and benefits | $14,000 |
| Total Personnel | $175,000 |
The pastor's housing allowance is a church-specific tax item. Under IRS Section 107, a minister can exclude a housing allowance from federal income tax — it must be designated in advance by the governing board and limited to actual housing costs. This has no equivalent in secular nonprofit budgeting. See how the housing allowance appears as a separate line in our church income statement example.
Facilities Detail
| Line Item | Amount |
|---|---|
| Mortgage or rent | $42,000 |
| Utilities | $18,000 |
| Property insurance | $9,000 |
| Maintenance and repairs | $12,000 |
| Janitorial supplies | $4,000 |
| Capital reserve contribution | $2,500 |
| Total Facilities | $87,500 |
Missions and Benevolence Detail
| Line Item | Amount |
|---|---|
| Missionary support | $15,000 |
| Denominational giving / cooperative program | $14,000 |
| Local outreach partnerships | $8,000 |
| Short-term mission trips | $4,500 |
| Benevolence fund | $4,000 |
| Total Missions and Benevolence | $45,500 |
Programs and Ministries Detail
| Line Item | Amount |
|---|---|
| Children's ministry (curriculum, supplies) | $10,000 |
| Youth ministry | $8,000 |
| Worship and music (licensing, equipment) | $7,500 |
| Adult discipleship and small groups | $5,500 |
| Women's and men's ministries | $4,000 |
| Total Programs | $35,000 |
Need a ready-made budget template for your church?
Download a pre-built spreadsheet with industry-specific categories, formulas, and formatting.
Percentage Benchmarks by Category
Vanderbloemen's analysis of roughly 1,000 churches with budgets between $500,000 and $10 million provides the clearest ranges for each major category:
| Category | Healthy Range | Warning Zone |
|---|---|---|
| Personnel | 45–55% | Above 60% |
| Facilities | 20–30% | Above 35% |
| Missions and benevolence | 10–15% | Below 5% |
| Programs and ministries | 10–15% | Below 5% |
| Savings and reserves | 5–10% | 0% (no margin) |
Personnel above 60% usually signals one of two problems: the church is maintaining staff levels that outpaced giving growth, or facilities and programs are being underfunded to sustain payroll. Either way, the budget isn't sustainable at those levels.
Facilities above 35% is common in smaller congregations that own large buildings relative to their giving base, or in churches that took on too much mortgage during a building campaign. When facilities consume more than a third of income, there's little room for the mission-oriented spending that drives church growth.
Church Budget vs. Nonprofit Budget: Key Differences
Church budgets look similar to nonprofit budgets on the surface, but several features are unique to churches:
Fund accounting is essential. A church typically manages multiple funds simultaneously: the general operating fund, a building fund, a missions fund, and a benevolence fund. Money designated by donors for missions can't be redirected to cover a payroll shortfall. Each fund needs to be tracked separately, and the board needs to see the balance of each — not just total cash.
The benevolence fund operates under IRS guidelines. To maintain tax deductibility, benevolence distributions must follow a documented policy: a committee (not a single pastor) reviews applications, decisions are based on financial need rather than the donor's designation, and recipients must be chosen from an open class. A church that lets the pastor decide benevolence distributions unilaterally is creating both a tax risk and a governance problem.
Denominational giving is a budget line. Churches affiliated with a denomination often have a mandatory or expected giving assessment — the SBC Cooperative Program, United Methodist apportionments, or similar. This is distinct from local missions giving and needs its own line item. For some churches, it's 5–10% of income.
Capital campaigns run parallel to operating budgets. When a church undertakes a building project, it typically runs a multi-year capital campaign separately from the operating budget. Donors make pledges specifically to the building fund. These funds are restricted to capital use and must be tracked separately — they can't fund salaries or programs.
No Form 990 required. Unlike other nonprofits, churches are exempt from filing Form 990. This reduces administrative burden but also reduces external accountability pressure. Churches seeking to build donor confidence can pursue ECFA accreditation — the Evangelical Council for Financial Accountability accredits over 2,700 churches and ministries against standards for governance, financial transparency, and compensation practices.
Common Church Budget Mistakes
Projecting optimistic income. The most common error is building a budget around hoped-for growth rather than realistic projections. The Assemblies of God and others recommend budgeting on 90% of prior-year income — building in a 10% margin rather than planning to spend everything received.
No cash flow awareness. Annual budgets don't reflect the reality that giving drops significantly in June, July, and August and spikes in December. A church that spends evenly throughout the year will be cash-short every summer. Track monthly cash flow, not just annual totals.
Personnel creep. Adding staff is easy; removing it is painful. Many churches find their personnel line growing 2–3% per year while giving grows 0–1%. When personnel exceeds 55–60% of budget, the church has less flexibility to fund mission, facilities maintenance, and program growth.
No capital reserve. Facilities don't last forever. HVAC systems, roofs, parking lots, and audio-visual equipment all need replacement. A church that budgets only for operations while deferring maintenance is accumulating deferred liability. Even a small capital reserve line — $2,000–$5,000 per year — prevents emergency spending that disrupts the operating budget. A church expense tracker helps flag maintenance costs that should be budgeted as capital reserves.
Breaking even as the plan. A budget that hits exactly zero provides no buffer. Unexpected expenses (a boiler failure, a legal fee, a key staff departure) immediately create a deficit. Building a planned surplus — even $10,000–$15,000 — is the only way to grow reserves and create organizational resilience.
Incremental budgeting. Rolling last year's budget forward with a percentage increase doesn't force the church to justify each line item. Zero-based budgeting — rebuilding the budget from the ground up each year — surfaces expenses that no longer align with current priorities and keeps spending tied to current ministry plans.
How to Build Your Church Budget
Start with the prior year's actual income and expenses, not the prior year's budget. What the church actually received and spent is the baseline. Adjust for known changes: a staff hire or departure, a mortgage refinance, a new ministry launch.
Then build from the percentage benchmarks. If personnel is currently at 60%, that's a constraint that shapes everything else. If missions is below 10%, that's a conversation the leadership team needs to have. For a deeper look at fund accounting rules and the controls that keep budgets honest, see our church accounting best practices guide.
For congregations that haven't built a structured budget before, a Church Budget Template provides the fund accounting structure, personnel detail, and category tracking that most spreadsheets built from scratch miss.
The budget should go to the governing board — elder board, deacon board, or finance committee — for review before it's presented to the congregation. Most denominations and governance best practices call for congregational approval of the annual budget. That process only works if the budget is clear enough for non-finance people to understand: what the church plans to receive, where it plans to spend it, and what the plan is if income comes in below expectations.
Review actuals against budget at least quarterly. A budget reviewed once a year in January isn't a management tool — it's a historical document.
For churches also tracking month-to-month financial position, a Church Cash Flow Template helps manage the seasonal giving swings that catch congregations short during summer months.
Last updated: March 23, 2026
Frequently Asked Questions
Related Articles
Coffee Shop Budget Example: Real Numbers and Benchmarks
A practical coffee shop budget example with real cost benchmarks — covering beverage COGS, labor, rent, equipment maintenance, and the line items most operators underestimate.
Construction Budget Example: Line Items, Percentages, and What to Include
A practical construction budget example covering hard costs, soft costs, overhead allocation, and the line items most contractors underestimate.
Daycare Budget Example: Categories, Benchmarks, and What to Watch
A practical daycare budget example covering revenue sources, expense ratios, occupancy thresholds, and the line items that determine whether a center stays financially viable.
Event Planning Budget Example: Real Numbers for Your Business
A practical event planning budget example covering agency overhead, per-event costs, revenue models, and the benchmarks every planner needs to protect margins.
Hotel Budget Example: Departments, Benchmarks, and Real Numbers
A practical hotel budget example covering the USALI department structure, labor benchmarks, GOP targets, and the line items independent hoteliers most often miss.
What Is a Good Landscaping Budget? Benchmarks and Examples
A landscaping business budget breakdown covering labor, materials, equipment, overhead benchmarks, and the margin targets that separate profitable companies from struggling ones.