Retail Budget Example: Line Items, Benchmarks, and What to Include
A practical retail budget example with real benchmarks — covering gross margin by category, labor, occupancy, shrinkage, and the open-to-buy concept most owners overlook.
Retail net margins are thin — typically 2–6% on annual sales. That leaves almost no room for cost surprises. A retail budget built with the right categories and realistic benchmarks tells you exactly how much margin you have to work with, where it's going, and what happens when costs run over.
Here's what a retail budget actually looks like, with the line items and benchmarks you need to build one that works.
Revenue: What to Track and How
The starting point is revenue broken down by how you actually sell — not as a single total.
Revenue categories to budget separately:
- In-store sales — your primary line, broken down by product category or department if you carry multiple categories with different margins
- Online / e-commerce sales — if you sell online, keep this separate from in-store; the cost structure is different (shipping, platform fees, higher return rates)
- Services — alterations, repairs, installation, customization where applicable
- Gift card breakage — the portion of gift cards sold but never redeemed, recognized as income
Revenue reductions to budget explicitly:
- Customer returns and allowances — returns averaged about 16.9% of total sales across retail in 2024, according to NRF data. Budget this as a reduction to gross revenue, not as an afterthought
- Promotional markdowns — planned discounts, clearance events, and end-of-season reductions reduce effective revenue and should be budgeted before the season begins
Separate in-store and online revenue from the start. A store with $400,000 in physical sales and $200,000 in e-commerce revenue needs different cost structures for each channel — mixing them obscures what's actually profitable.
Gross Margin Benchmarks by Retail Category
Gross margin is the most important number in a retail budget. Everything else — labor, rent, marketing, profit — comes out of it.
| Retail Category | Typical Gross Margin | Implied COGS % of Revenue |
|---|---|---|
| Apparel and clothing | 40–52% | 48–60% |
| Sporting goods and outdoor | 35–45% | 55–65% |
| Hardware and home improvement | ~34% | ~66% |
| Grocery and food retail | ~25% | ~75% |
| Electronics | 15–25% | 75–85% |
Source: NYU Stern School of Business operating margin data (January 2024); Statista retail gross margin data.
The keystone pricing reality. Many retailers set prices using keystone markup — doubling wholesale cost, which implies a 50% gross margin. In practice, realized gross margin is lower once you account for markdowns, damaged goods, and returns. Budget using your maintained margin (what you actually realize after deductions) rather than your initial markup target. Our retail pricing guide covers the full markup-to-margin math and when keystone works versus when it doesn't.
The critical test: Your gross margin percentage must exceed your total operating expense percentage, with enough left over for your profit target. If labor, rent, and overhead together total 45% of revenue, you need at least a 50%+ gross margin before any profit exists. That's why category mix and supplier negotiations matter so much — every 1% of gross margin gained on $500,000 in sales is $5,000 straight to the bottom line.
Labor, Occupancy, and Operating Costs
Labor
Retail labor typically runs 15–25% of total revenue, according to Shopify's retail expense analysis and BLS data. The range reflects differences in store format, service level, and local wage rates.
What to include in labor cost:
- Hourly wages for sales associates, stockroom, and cashiers
- Management salaries — store manager, assistant managers
- Payroll taxes — Social Security, Medicare, FUTA, SUTA (adds roughly 10–12% to wage cost)
- Workers' compensation insurance
- Benefits — health insurance, paid leave, retirement contributions if offered
Budget labor at the fully loaded rate, not just base wages. A $16/hour associate costs roughly $18–$18.50/hour after employer-side payroll taxes. For retail operations with commission-based sales staff, tracking those variable compensation costs is just as important — Carvd automates the calculations.
Occupancy
A healthy rent-to-sales ratio is 5–10% of gross annual sales, with total occupancy costs (rent, CAM charges, property taxes) often running 6–12%. Above 15% signals real estate inefficiency that's hard to overcome with normal retail margins.
What occupancy typically includes:
- Base rent
- Common area maintenance (CAM) charges — cleaning, security, landscaping in shared centers
- Property taxes (if passed through in your lease)
- Building insurance
Occupancy costs are largely fixed once you sign the lease, which is why site selection and rent negotiation determine profitability before you open. A location requiring 12–15% of projected revenue in rent leaves almost nothing after COGS and labor.
Other Operating Expenses
| Category | Typical Range (% of Revenue) |
|---|---|
| Shrinkage reserve | 1.5–2.0% |
| Marketing and advertising | 5–8% |
| Payment processing fees | 1.5–3.5% |
| Utilities | 1.5–3.0% |
| Technology and POS | 0.5–1.5% |
| Business insurance | 0.5–1.5% |
| Supplies and packaging | 0.3–1.0% |
| Professional services (accounting, legal) | 0.5–1.0% |
| Contingency | 1.0–2.0% |
Shrinkage deserves its own line. The NRF's National Retail Security Survey (FY2022, the most recent comprehensive data) put average shrinkage at approximately 1.6% of sales — split roughly between external theft (37%), employee theft (28%), and administrative errors (26%). A $600,000 store should budget roughly $9,600–$12,000 per year for shrinkage losses. Cycle counting and strong inventory management practices catch shrinkage before it compounds.
Payment processing is underbudgeted. At 1.5–3.5% of sales, processing fees can cost a $600,000-revenue store $9,000–$21,000 annually — more than most owners realize when they set up their merchant account.
Need a ready-made budget template for your retail?
Download a pre-built spreadsheet with industry-specific categories, formulas, and formatting.
The Open-to-Buy Budget
Open-to-buy (OTB) is the most retail-specific budgeting concept and the one most independent retailers skip. It calculates how much inventory you're authorized to purchase in a given period.
The formula:
OTB = Planned Sales + Planned Markdowns + Planned End-of-Period Inventory − Beginning Inventory
In practice: if you're planning $80,000 in sales in March, expect $5,000 in markdowns, want $60,000 in ending inventory, and you're starting with $55,000 of inventory on hand — your OTB for March is $90,000.
That tells you exactly how much you can buy. Without it, retailers systematically overbuy in slow seasons (inventory sits, cash is tied up, markdowns follow) and underbuy during peak seasons (stockouts, missed revenue).
OTB is planned by product category or department, not just in total. If apparel and accessories have different margin profiles and different turnover rates, they need separate OTB calculations.
For a pre-built retail budget that includes OTB planning alongside your P&L categories, the Retail Budget Template has the structure already set up by month.
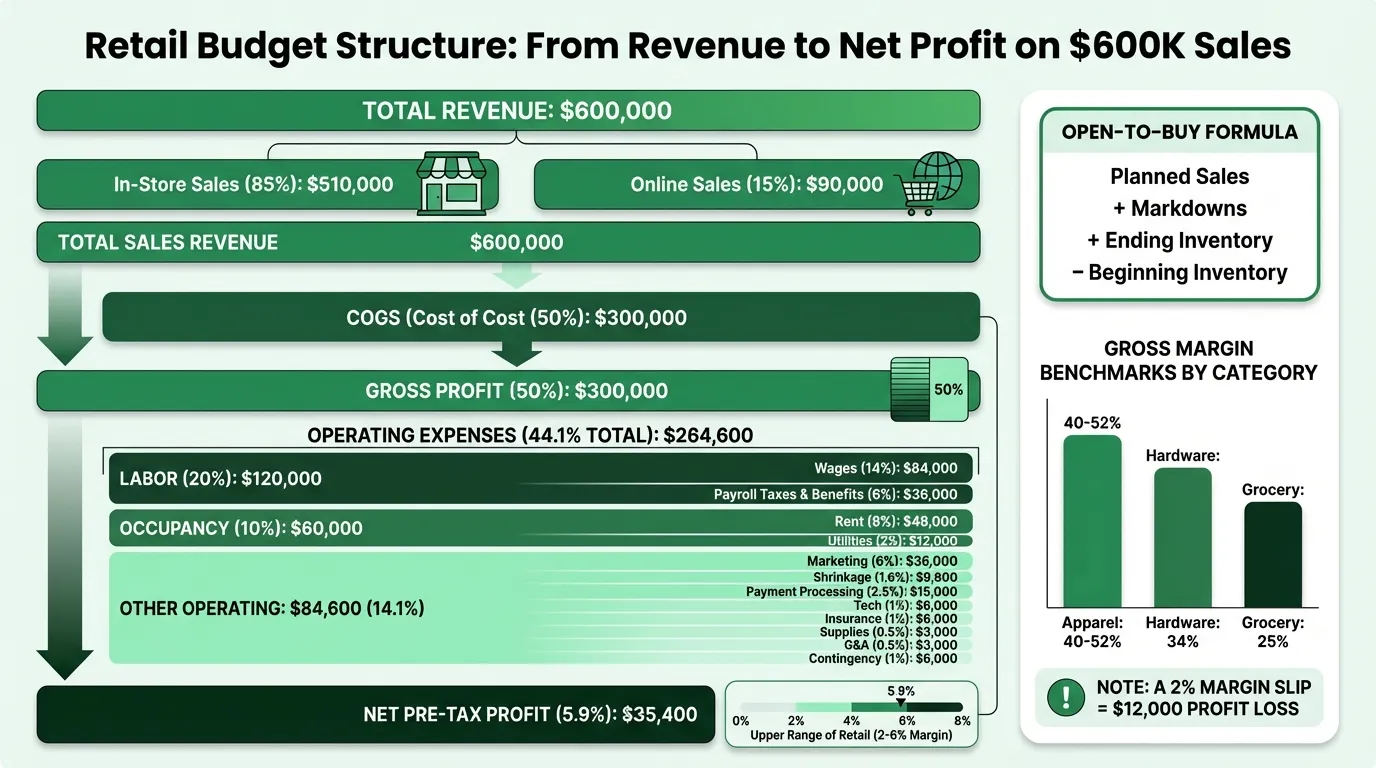
Example: A $600,000 Retail Store Budget
Here's a realistic annual budget for a mid-size specialty apparel retailer:
Revenue
| Category | Amount | % of Revenue |
|---|---|---|
| In-store product sales | $510,000 | 85% |
| Online sales | $90,000 | 15% |
| Total Revenue | $600,000 |
Cost of Goods Sold
| Category | Amount | % of Revenue |
|---|---|---|
| Product cost (50% of sales) | $300,000 | 50% |
| Gross Profit | $300,000 | 50% |
Operating Expenses
| Category | Amount | % of Revenue |
|---|---|---|
| Payroll — wages and salaries | $84,000 | 14% |
| Payroll taxes and benefits | $36,000 | 6% |
| Total Labor | $120,000 | 20% |
| Rent | $48,000 | 8% |
| Utilities | $12,000 | 2% |
| Marketing and advertising | $36,000 | 6% |
| Shrinkage reserve | $9,600 | 1.6% |
| Payment processing | $15,000 | 2.5% |
| Technology and POS | $6,000 | 1% |
| Insurance | $6,000 | 1% |
| Supplies and packaging | $3,000 | 0.5% |
| Professional services | $3,000 | 0.5% |
| Contingency | $6,000 | 1% |
| Total Operating Expenses | $264,600 | 44.1% |
| Net Pre-Tax Profit | $35,400 | 5.9% |
This example hits near the upper end of the typical retail net margin range (2–6%). It depends on hitting the 50% gross margin target consistently — a 2% slip in gross margin would cut $12,000 from the bottom line, dropping net profit to $23,400 (3.9%). That's the fragility of thin-margin retail: cost discipline at every line matters. Use our retail markup calculator to verify that your pricing produces the margin your budget assumes.
Seasonal Planning
Almost every retail store has pronounced seasonality. Many specialty retailers generate 25–40% of annual revenue in Q4 alone. A budget that doesn't reflect this will show January as a failure and December as easy — neither of which is useful.
Build a monthly budget, not just an annual total:
- Pull your prior year's monthly sales from your POS or accounting system
- Calculate each month's revenue as a percentage of the annual total
- Apply those percentages to your annual revenue projection
If January historically represents 5% of annual sales and December represents 18%, that's your starting assumption. A flat one-twelfth each month is unrealistic for most retail operations. Tracking retail KPIs by month makes seasonal patterns visible before they become budget surprises.
Budget inventory purchases before the season, not during it. If your holiday peak starts in October, you're buying October-November-December inventory in August and September. Your budget should show the cash outflow for inventory 6–8 weeks before the revenue arrives. A line of credit sized to cover this gap is a normal part of retail operations — plan for it rather than scrambling for it.
The budget and cash flow picture look different in retail. A profitable store can run short on cash in September because it's paying for holiday inventory before holiday sales arrive. The Retail Budget Template separates the P&L budget from the monthly cash flow view so you can see both.
Common Retail Budgeting Mistakes
Using one gross margin percentage for all products. A store that sells both $15 accessories (60% margin) and $300 electronics (25% margin) can't budget at an average margin. As the product mix shifts, actual margin moves — and the budget won't tell you why profits changed.
Forgetting shrinkage until it shows up in inventory counts. A 2% shrinkage rate is normal and foreseeable. Budget for it the same way you budget for rent. The retailers who get surprised by shrinkage are the ones who never built it into the plan.
Not budgeting markdowns. Promotional discounts and clearance events aren't unexpected — they're part of the business model. Budget markdowns as a percentage of sales by season so the cost shows up in the plan rather than appearing as an unexplained margin shortfall.
Ignoring the monthly distribution. Budgeting $600,000 annually without distributing it by month means you have no baseline to compare against each month's actual results. The budget becomes useless as a management tool.
Treating OTB as optional. Overbought inventory sitting on shelves is one of the most common and most preventable cash drains in retail. The open-to-buy discipline forces alignment between what you're planning to sell and what you're authorized to buy.
A budget that covers all of these — with monthly columns, gross margin by category, OTB planning, and a budget-vs-actual comparison — is what the Retail Budget Template is built to handle. If you're also managing cash flow alongside the budget, the Budget Templates section includes other industry formats that follow the same structure.
Last updated: March 23, 2026
Frequently Asked Questions
Related Articles
Coffee Shop Budget Example: Real Numbers and Benchmarks
A practical coffee shop budget example with real cost benchmarks — covering beverage COGS, labor, rent, equipment maintenance, and the line items most operators underestimate.
Church Budget Example: Categories, Percentages, and What to Include
A practical church budget example with real percentages for staff, facilities, missions, and programs — plus the line items most churches overlook.
Construction Budget Example: Line Items, Percentages, and What to Include
A practical construction budget example covering hard costs, soft costs, overhead allocation, and the line items most contractors underestimate.
Daycare Budget Example: Categories, Benchmarks, and What to Watch
A practical daycare budget example covering revenue sources, expense ratios, occupancy thresholds, and the line items that determine whether a center stays financially viable.
Event Planning Budget Example: Real Numbers for Your Business
A practical event planning budget example covering agency overhead, per-event costs, revenue models, and the benchmarks every planner needs to protect margins.
Hotel Budget Example: Departments, Benchmarks, and Real Numbers
A practical hotel budget example covering the USALI department structure, labor benchmarks, GOP targets, and the line items independent hoteliers most often miss.