Coffee Shop Income Statement Example: Revenue, Costs, and Margins
A coffee shop income statement example with beverage cost benchmarks, labor targets, prime cost rules, and a worked P&L for an independent café doing $480K/year.
Coffee drinks have the best COGS of almost any food service product — a $5.50 latte typically costs $0.80–$1.10 in ingredients. Yet the average independent coffee shop earns a net margin of 10–18%, not the 70–75% the ingredient math might suggest. The gap between that beverage gross margin and the bottom line is the income statement story: labor, rent, and operating expenses that consume what the espresso machine produces.
Reading a coffee shop income statement means understanding each cost layer and what the benchmarks look like at each one.
Revenue: More Than Just Coffee
Most independent cafés have two or three revenue streams on the income statement, even if the owner thinks of the business as "just a coffee shop."
Beverage sales are the core and typically represent 70–80% of total revenue. This includes espresso drinks, brewed coffee, cold brew, tea, and non-coffee beverages. Beverages have the highest gross margin of any category, which is why the product mix matters — a café shifting toward more food items without price adjustment will see blended margins compress.
Food and pastry sales typically run 15–25% of revenue for cafés with a meaningful food program. Margins on food are lower than on beverages (pastries run 30–40% COGS versus 15–25% for drinks), and food introduces spoilage risk that coffee beans and syrups don't carry. Many independent operators source baked goods from local bakeries rather than baking in-house — outsourcing the production risk while maintaining a food offering.
Merchandise and whole bean sales — branded mugs, bags of house-roast coffee, merchandise — are a small but high-margin revenue line for cafés that invest in their brand identity. Whole bean retail allows regulars to buy coffee to brew at home, capturing revenue that would otherwise go to a grocery store.
Catering and wholesale appear on the income statement for shops that supply offices, corporate events, or local businesses. Catering tends to generate better margins than street café sales because the operator can plan exact quantities, eliminating waste.
Average annual revenue for a well-run single-location independent coffee shop is $450,000–$500,000 (Paytronix, 2025). Cafés in high-foot-traffic urban locations or those with a strong food program can reach $700,000–$1,000,000. Drive-through only formats can exceed $1 million at top-quartile operators.
Cost of Goods Sold: The Beverage Math
COGS on a coffee shop income statement covers everything that goes directly into what's sold: coffee beans, espresso, milk and non-dairy alternatives, syrups and flavorings, food purchases, and packaging (cups, lids, sleeves, napkins).
Industry benchmarks by category:
| COGS Category | % of Revenue | Notes |
|---|---|---|
| Coffee/espresso ingredients | 8–12% | Core beverage inputs |
| Dairy and non-dairy milk | 4–7% | Price-sensitive; oat milk carries premium cost |
| Syrups, flavorings, toppings | 2–3% | |
| Food/pastry purchases | 6–10% | Higher if full food program |
| Packaging and disposables | 2–4% | |
| Blended COGS (target) | 25–35% | Ideal range for most cafés |
The target blended COGS is 25–35% of total revenue. Beverage-forward shops with minimal food programs can operate at the low end (22–28%). Shops with a heavy food program — sandwiches, soups, full breakfast items — tend toward the high end (30–35%) because food COGS exceeds beverage COGS by a meaningful margin.
One input to watch heading into 2026: Arabica coffee prices reached $4.41/lb in early 2026, well above the five-year average, reflecting supply disruptions in Brazil and trade volatility. Operators on fixed wholesale contracts are partially insulated; those buying spot are seeing real COGS pressure. The coffee shop food cost calculator helps you model how rising bean prices affect your per-drink COGS.
Labor: The Dominant Cost
Labor — wages, employer payroll taxes, and benefits — is the single largest operating expense for most coffee shops. The National Restaurant Association benchmarks coffee shop labor at 20–30% of revenue; independent shops often run closer to 25–35% due to less optimized scheduling and smaller scale.
The labor percentage is the most volatile line on a coffee shop income statement because it varies with:
- Scheduling efficiency. Overstaffed slow mornings inflate labor percentage even when peak hours are well-managed. Shift-by-shift scheduling with sales-to-labor ratio targets is how well-run shops control this.
- Minimum wage changes. As of January 2026, 19 U.S. states implemented minimum wage increases. For a shop running 10 employees at an average of 30 hours per week, a $1/hour minimum wage increase adds roughly $15,600 annually to the labor line.
- Owner operator labor. Independent café owners who work the bar but don't pay themselves a market-rate wage show artificially low labor percentages. A realistic income statement should include owner compensation at market rate (typically $45,000–$65,000/year for a working operator) to accurately reflect the business economics.
Prime cost — COGS plus total labor — is the combined metric that matters most. For coffee shops, prime cost should stay below 60–65% of revenue. A shop running above 65% prime cost will struggle to generate net income regardless of how well it manages rent, marketing, or other discretionary expenses.
Occupancy and Other Operating Expenses
Rent and occupancy costs are the second-most discussed line after labor. Industry targets:
- Rent alone: 6–10% of gross revenue
- Total occupancy (rent + common area maintenance + utilities): ideally under 15% combined
A café signing a lease should model rent as a percentage of realistic projected revenue before committing. A $4,000/month lease on a space projected to do $50,000/month in revenue is 8% — within range. The same lease on a shop doing $35,000/month is 11.4% — tight. Occupancy cost is fixed while revenue fluctuates, which means a lease that works at target revenue becomes a problem during slow months.
The other operating expense lines:
| Expense | % of Revenue |
|---|---|
| Utilities (electricity, gas, water) | 2–5% |
| Equipment maintenance and repair | 1–3% |
| Insurance (general liability, property, workers' comp) | 1–3% |
| POS system and technology subscriptions | 1–2% |
| Credit card processing fees | 1.5–2.5% |
| Marketing and advertising | 2–5% |
| Permits and licenses | 0.5–1% |
| Office and administrative supplies | 0.5–1% |
Credit card processing fees are easy to underestimate. With the average coffee transaction at $5–$8 and most customers paying by card, processing runs 2–3% per transaction. At $480,000 in annual revenue, that's $9,600–$14,400 per year — a real line that belongs explicitly on the income statement.
Need a ready-made income statement template for your coffee shop?
Download a pre-built spreadsheet with industry-specific categories, formulas, and formatting.
Full Income Statement Structure
A coffee shop income statement organized for management decisions:
Revenue
- Beverage sales
- Food/pastry sales
- Merchandise and whole bean sales
- Catering and wholesale
- Total Revenue
Cost of Goods Sold
- Coffee and espresso ingredients
- Dairy and non-dairy milk
- Syrups, flavorings, and toppings
- Food and pastry purchases
- Packaging and disposables
- Total COGS
Gross Profit
Operating Expenses
- Labor — barista and front-of-house wages
- Labor — management and owner compensation
- Payroll taxes (FICA, FUTA, SUTA)
- Employee benefits (health insurance, retirement)
- Rent / lease
- Common area maintenance (CAM)
- Utilities
- Equipment maintenance and repair
- Equipment depreciation
- Insurance (general liability, property, workers' comp)
- POS system and technology
- Credit card processing fees
- Marketing and advertising
- Permits and licenses
- Professional services (accounting, legal)
- Total Operating Expenses
Operating Income
- Interest expense (equipment financing, SBA loan)
Net Income
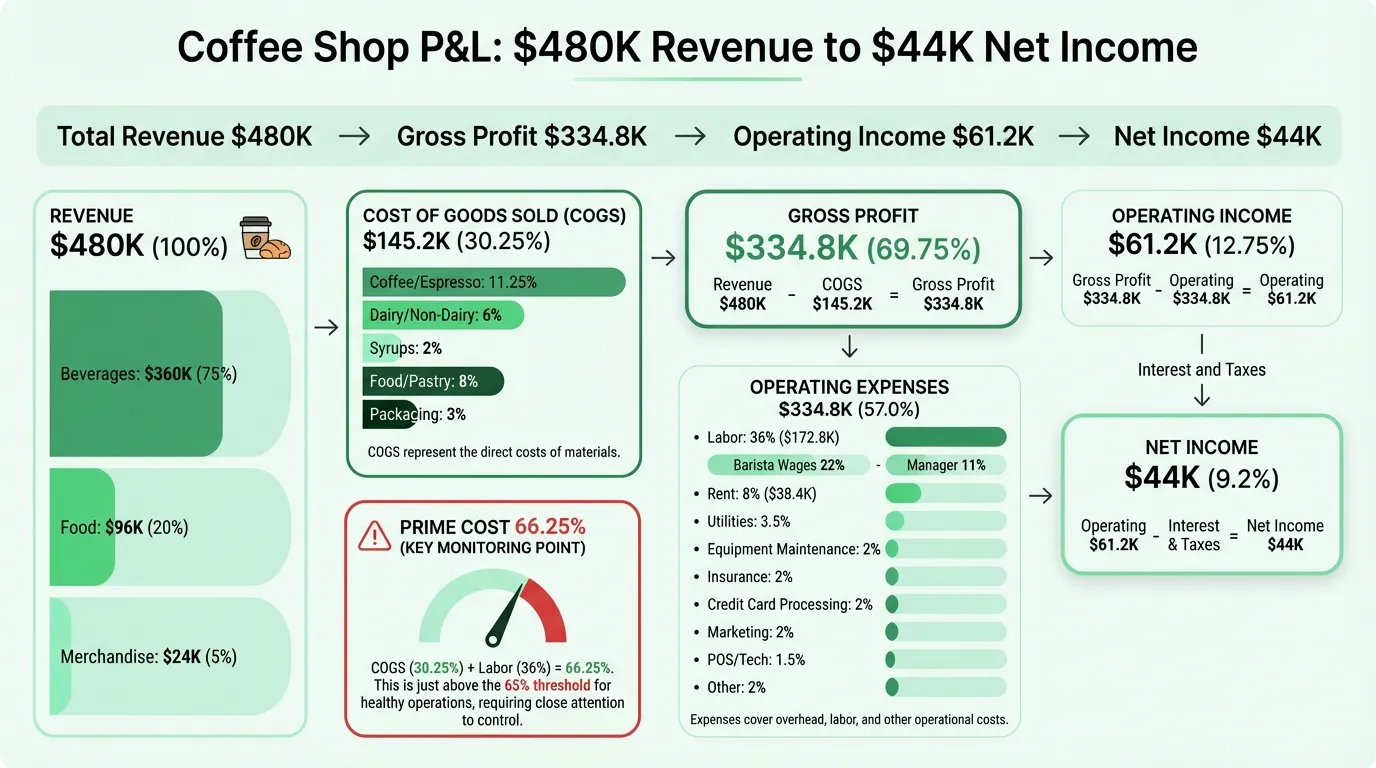
Worked Example: Independent Café at $480K Revenue
Here's a realistic annual income statement for a single-location independent café — sit-down format with espresso bar, light food program, and a small whole bean retail section.
Revenue
| Line | Annual | % of Revenue |
|---|---|---|
| Beverage sales | $360,000 | 75.0% |
| Food and pastry sales | $96,000 | 20.0% |
| Merchandise and whole bean | $24,000 | 5.0% |
| Total Revenue | $480,000 | 100% |
Cost of Goods Sold
| Line | Annual | % of Revenue |
|---|---|---|
| Coffee/espresso ingredients | $54,000 | 11.25% |
| Dairy and non-dairy milk | $28,800 | 6.0% |
| Syrups, flavorings, toppings | $9,600 | 2.0% |
| Food/pastry purchases | $38,400 | 8.0% |
| Packaging and disposables | $14,400 | 3.0% |
| Total COGS | $145,200 | 30.25% |
Gross Profit: $334,800 (69.75%)
The blended COGS of 30.25% reflects a mix of high-margin espresso drinks and lower-margin food items. The beverage-only COGS (ingredients + dairy + syrups + packaging) is approximately 22.25% — within the efficient range. The food program adds 8% on top.
Operating Expenses
| Line | Annual | % of Revenue |
|---|---|---|
| Barista and shift wages | $105,600 | 22.0% |
| Manager / owner compensation | $52,800 | 11.0% |
| Payroll taxes | $14,400 | 3.0% |
| Total labor | $172,800 | 36.0% |
| Rent | $38,400 | 8.0% |
| Utilities | $16,800 | 3.5% |
| Equipment maintenance | $9,600 | 2.0% |
| Insurance | $9,600 | 2.0% |
| Credit card processing fees | $9,600 | 2.0% |
| Marketing | $9,600 | 2.0% |
| POS and technology | $7,200 | 1.5% |
| Permits and licenses | $2,400 | 0.5% |
| Professional services | $4,800 | 1.0% |
| Office and administrative | $2,400 | 0.5% |
| Total Operating Expenses | $273,600 | 57.0% |
Operating Income: $61,200 (12.75%)
Below Operating Income
| Line | Amount |
|---|---|
| Interest expense (equipment loan) | ($4,800) |
| Pre-tax income | $56,400 |
| Self-employment and income taxes (~22% effective) | ($12,400) |
| Net Income | $44,000 |
Net margin: 9.2%
The 9.2% net margin is slightly below the industry average of 13.8%, primarily because the labor percentage (36%) runs above benchmark. The $52,800 owner compensation is included at a market-rate assumption — an operator who doesn't draw a salary would show apparent profitability of roughly $97,000 (20.2% margin) on the same business. Including owner compensation reflects reality: the business needs to support the operator's livelihood to be a sustainable enterprise.
Prime cost check: 30.25% COGS + 36% labor = 66.25% prime cost. This is just above the 65% threshold — the signal that labor efficiency deserves attention before it becomes a structural problem. For a forward-looking view of these same cost categories, see our coffee shop budget example with benchmarks and planning targets.
The Three Numbers to Watch Monthly
Most operational decisions in a coffee shop come down to three metrics on the income statement:
COGS percentage. If this creeps above 33–34%, the first question is whether it's a product mix shift (more food, less coffee), a purchasing problem (paying more for beans or milk), or a waste problem (over-prepping, spoilage on food items). Each has a different fix.
Labor as a percentage of revenue. The most volatile line and the one most within the operator's control via scheduling. A shop tracking actual labor percentage weekly can adjust staffing before a bad month compounds into two bad months. Benchmark: flag anything above 33% for a café with modest owner compensation. Use the coffee shop profit margin calculator to see how labor shifts affect your net margin.
Prime cost. The single combined number that determines whether the shop has money left for rent, utilities, and growth. Below 60% leaves meaningful room; 60–65% is workable but tight; above 65% and the income statement will struggle to show net profit regardless of how well non-labor, non-COGS expenses are managed.
Coffee Shop vs. Restaurant Income Statement
Coffee shops and restaurants share the same P&L structure but differ on key ratios:
| Line Item | Coffee Shop | Full-Service Restaurant |
|---|---|---|
| Blended COGS | 25–35% | 28–35% |
| Labor | 25–35% | 30–35% |
| Prime cost target | Below 60–65% | Below 60–65% |
| Occupancy | 6–10% | 8–12% |
| Net margin (avg) | 10–18% | 3–6% |
Coffee shops typically outperform restaurants on net margin because the core product — espresso drinks — has structurally lower COGS than restaurant entrées, and service requires fewer staff per customer than a full-service dining room. The trade-off is revenue ceiling: a single café has a physical throughput limit that a multi-turn dining room can overcome with table turns. The Coffee Shop P&L Template structures these comparisons with coffee-specific line items rather than generic restaurant categories.
For a pre-built version in Excel, the Coffee Shop Income Statement Template includes beverage and food COGS tracking, labor percentage calculations, and the full P&L structure above. If you're managing the broader financial picture, the Coffee Shop Budget Template and Cash Flow Template complement the income statement with forward-looking planning tools.
Reading the Statement Over Time
A single month's income statement tells you where you landed. The trend across 6–12 months tells you whether the business is improving or drifting.
The most common drift patterns in coffee shop income statements:
-
Labor creep. Hiring one extra part-time employee who becomes permanent adds $15,000–$25,000 per year to the labor line without a corresponding revenue increase. Checked monthly, this is a scheduling adjustment. Caught after 12 months, it's a structural margin problem.
-
Food program margin dilution. Adding more food items seems like a revenue opportunity, but if each item carries 35–40% COGS versus the 22% on beverages, the blended COGS rises quietly every quarter.
-
Lease step-ups. Multi-year leases with annual escalation clauses (typically 3–5% per year) increase the rent line predictably. Knowing when each step-up hits — and modeling it against revenue projections — prevents surprises.
Tracking the income statement monthly against a budget, and reviewing the three core metrics weekly, is the habit that separates operators who understand their business from those who find out about problems when the bank account gets tight.
Last updated: March 24, 2026
Frequently Asked Questions
Related Articles
Daycare Income Statement Example: Revenue, Costs, and Margins
A daycare income statement example with tuition revenue, CACFP reimbursements, staff cost benchmarks, and a worked P&L for a 50-child childcare center.
Food Truck Income Statement Example: Line Items and Benchmarks
A food truck income statement example with food cost benchmarks, unique line items like commissary and pitch fees, and a worked P&L for a single-truck operation.
Healthcare Income Statement Example: Revenue, Expenses, and Margins
A healthcare income statement example covering net patient revenue, contractual adjustments, expense benchmarks, and operating margin targets for providers.
Healthcare Pro Forma Example: What to Include and How to Build One
A practical healthcare pro forma example — covering revenue projections, payer mix, expense benchmarks, and a worked model for a new medical practice or service line.
Hotel Pro Forma Example: What to Include and How to Build One
A practical hotel pro forma example — covering RevPAR, GOP, undistributed expenses, FF&E reserves, and a worked model for acquisition or development underwriting.
Manufacturing Income Statement Example: Line Items and Benchmarks
A manufacturing income statement example with COGM schedule, gross margin benchmarks by subsector, and a worked P&L for a precision parts manufacturer.