Coffee Shop Budget Template
Plan and track your coffee shop's finances with a budget template built for cafes — pre-loaded with beverage cost, labor, and overhead categories that match how cafes actually operate.
What's Inside This Coffee Shop Budget Template
This template includes 4 worksheets, each designed for a specific part of your coffee shop financial workflow:
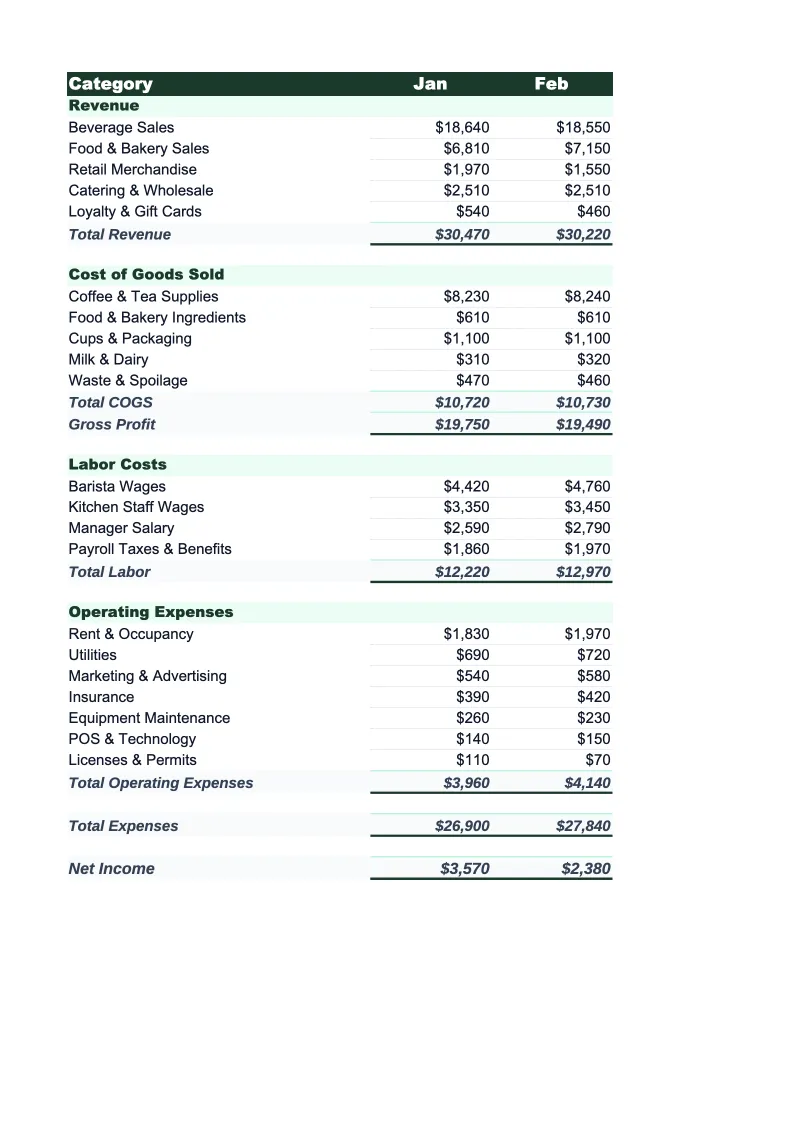
Monthly Budget
The core planning worksheet where you map out each month's revenue and expenses.
Annual Summary
A 12-month view that pulls data from each monthly sheet automatically.
Budget vs Actual
Compare what you planned to what you actually spent and earned.
Dashboard
A visual summary of your cafe's key financial metrics, built with pre-configured charts that update automatically as you enter data.
Coffee Shop Budget Template Features
- Revenue categories for espresso drinks, drip coffee, food, wholesale beans, and office accounts
- Beverage cost percentage auto-calculation (beans + dairy as % of drink revenue)
- Labor tracking split by baristas, leads, and management
- Monthly budget with 12-month annual rollup
- Budget vs actual variance tracking with color-coded formatting
- Dashboard with KPI charts for cost ratios and revenue trends
How to Use This Coffee Shop Budget Spreadsheet
Getting started takes about 15 minutes. Download the .xlsx file and open it in Excel or Google Sheets — no macros or plugins needed. Start with the Monthly Budget sheet and review the pre-loaded revenue and expense categories. Most coffee shop owners keep the structure as-is and just adjust a few line items: rename a revenue stream if you don't have a wholesale program, or add a specific equipment expense. Once you're happy with the categories, enter your projected numbers for the current month. If you're starting from scratch, use your last three months of bank statements to estimate a realistic baseline.
Build out the remaining months by copying the current month's structure and adjusting for what you know about your seasonal patterns. Fall and winter typically see higher hot-drink volume; summer may shift revenue toward cold brew and iced drinks. If you have a wholesale account or office coffee service, enter those revenue projections separately so you can track how much of your total revenue comes from each channel. The Annual Summary and Dashboard sheets update automatically as you fill in each month.
15 minutes from download to your first budget
Download the template, plug in your numbers, and see your coffee shop's full financial picture — monthly budget, annual rollup, and variance tracking included.
Why Every Coffee Shop Needs a Budget Template
Coffee shops operate on thin margins that leave almost no room for cost surprises. Gross margins look healthy at 60–70%, but after labor, rent, and overhead, net margins typically land between 5% and 15%. The difference between a profitable cafe and a break-even one often comes down to whether the owner is watching beverage cost percentage, labor cost percentage, and average ticket size on a regular basis — or only finding out the numbers are off when the bank account gets low.
A cafe budget needs to reflect how a coffee shop's costs actually behave. Beverage cost — beans plus dairy and alternative milks — is your most important variable cost line and should typically sit between 25% and 35% of drink revenue. Dairy is easy to overlook but adds up fast, especially as oat milk and other alternatives, which cost 2–3x more than dairy, become a larger share of orders. Labor is typically the largest single expense, often running 35–45% of total revenue for smaller cafes, and needs to be tracked against sales volume, not just dollar amount — overstaffing a slow Tuesday morning is where the margin goes. Rent should ideally sit under 15% of revenue, which makes location economics a critical variable when you're projecting.
Coffee Shop Industry at a Glance
Financial templates built for coffee shops and cafes — from single-location espresso bars to multi-location roasters. Pre-loaded with beverage cost categories, wholesale account structures, and industry KPIs.
Revenue Drivers
- Espresso & specialty drinks
- Drip coffee & batch brew
- Food & pastry sales
- Wholesale bean sales
- Office coffee service accounts
- Catering & event service
Key Cost Categories
- Coffee beans & specialty ingredients (COGS)
- Dairy & alternative milks
- Food/pastry COGS
- Labor
- Rent & occupancy
- Equipment maintenance & repair
- Packaging & supplies
- Marketing
Typical Margins
Gross: 60-70% · Net: 5-15%
Seasonality
Strongest in fall and winter when hot drink demand peaks; slower in summer unless cold brew and iced drink sales are high. Morning rush (6–10am) drives the majority of daily revenue.
Key Performance Indicators
Coffee Shop Budget Template FAQ
More Coffee Shop Templates
Coffee Shop Balance Sheet Template for Excel
$29
Coffee Shop Business Plan Template for Excel
$39
Coffee Shop Cash Flow Template for Excel
$29
Coffee Shop Expense Tracker Template for Excel
$29
Coffee Shop Financial Model Template for Excel
$29
Coffee Shop Income Statement Template for Excel
$29
Coffee Shop Invoice Template for Excel
$29
Coffee Shop KPI Dashboard Template for Excel
$29
Coffee Shop P&L Template for Excel
$29
Coffee Shop Pro Forma Template for Excel
$29
Coffee Shop Project Budget Template for Excel
$29
Coffee Shop Sales Forecast Template for Excel
$29
Coffee Shop Valuation Template for Excel
$29
Coffee Shop Budget Template
$29