Food Truck Income Statement Example: Line Items and Benchmarks
A food truck income statement example with food cost benchmarks, unique line items like commissary and pitch fees, and a worked P&L for a single-truck operation.
A food truck income statement looks similar to a restaurant P&L at the top — revenue minus food costs minus labor. But the middle section is different. Instead of a rent line, there's a bundle of location-access costs: commissary fees, parking permits, event pitch fees, and fuel. Understanding how those costs stack up — and what the benchmarks look like at each layer — is the starting point for reading or building a food truck P&L.
Revenue: Street Sales vs. Catering
Most food trucks have two revenue streams, and the split between them significantly affects profitability.
Street and event sales — Revenue from daily vending spots, food truck parks, festivals, and markets. This is typically the primary revenue source early in a truck's life, and it builds brand recognition. Margins on street stops run 10–20% after location costs and labor.
Catering and private events — Corporate lunches, weddings, private parties, and office catering. Catering tends to produce higher margins (50–60%) because the operator knows the headcount in advance, can prep precisely, charges a premium for the convenience, and often doesn't pay pitch fees to third-party venues. Successful operators increasingly shift their mix toward catering once they've built a following.
There's no single industry-standard split, but the strategic direction is consistent: street vending builds the brand, catering earns the money.
Average annual revenue for a well-run single food truck is approximately $346,000, with top-quartile trucks generating over $492,000 (foodtruckprofit.com, 2024). High-performing owner-operated trucks with strong catering programs can reach $750,000–$1,000,000+.
Food Costs (COGS): The First Margin Gate
Food cost — the cost of ingredients and direct supplies used to produce what you sell — is the primary COGS line on a food truck income statement.
Industry benchmarks by concept type:
| Concept Type | Food Cost % of Revenue |
|---|---|
| Coffee / beverages | 15–20% |
| Hot dogs / simple street food | 20–25% |
| Pizza | 20–28% |
| Gourmet burgers | 25–30% |
| Full-menu concepts | 28–33% |
| Tacos / protein-forward | 30–40% |
The target for most concepts is 25–35% of revenue. Keeping food cost below 30% while maintaining quality is the highest-leverage financial decision most food truck operators make. A $400,000 truck that holds food costs at 28% versus 33% generates $20,000 more in gross profit annually — more than many trucks net in an entire year.
Packaging and paper goods are often tracked separately from food cost: cups, containers, napkins, and bags typically run 2–4% of revenue. Combined food and packaging cost is the true COGS figure. The food truck food cost calculator helps you model ingredient cost per menu item so you can spot margin problems before they compound.
The Location-Access Cost Bundle
This is where the food truck income statement diverges most clearly from a restaurant. Instead of one rent line, there's a cluster of variable location costs:
Commissary / commercial kitchen rental — Most health departments require food trucks to operate out of a licensed commissary for food prep, overnight parking, equipment cleaning, and waste disposal. Cost: $300–$1,500/month depending on market, kitchen quality, and included services.
Daily parking permits — Public street vending permits in many cities run $25–$100/day. Annual permits in some markets replace per-day fees. Cities with active food truck programs often have lottery or waitlist systems for desirable spots.
Food truck park or private lot fees — Lot owners often charge revenue-share rates of 10–20% of daily sales, or flat monthly fees of $500–$2,000. This is often cheaper than negotiating individual street permits across multiple locations.
Event and festival pitch fees — Range from $100 for a small community market to $5,000+ for a major food and music festival. For multi-day festivals with high volume, pitch fees can be the best margin-per-event spend. For low-attendance events, a $500 pitch fee on $600 in sales is a loss.
Fuel — Driving fuel for route coverage plus propane or generator fuel for cooking. Combined fuel cost runs $300–$1,500/month depending on route density and equipment.
The total location-access bundle — commissary, parking, events, fuel — typically runs 8–15% of revenue. For comparison, a similar-volume restaurant might pay 8–12% of revenue in rent. The food truck's costs are lower on average, but more variable and spread across more line items.
Full Income Statement Structure
A food truck income statement follows the standard multi-step format with food-truck-specific categories:
Revenue
- Street and event sales
- Catering and private events
- Total Revenue
Cost of Goods Sold
- Food cost (ingredients)
- Packaging and paper goods
- Total COGS
Gross Profit
Operating Expenses
- Owner and staff wages
- Payroll taxes and benefits
- Commissary rental
- Truck loan / lease payment
- Fuel (driving + cooking)
- Insurance (commercial auto + general liability)
- Parking permits and lot fees
- Event and pitch fees
- Maintenance and repairs
- POS and technology fees
- Permits and licenses (amortized)
- Marketing
- Total Operating Expenses
Operating Income
Below operating income: interest expense (on truck financing), any other non-operating items, and income tax (often pass-through for sole proprietors and LLCs).
Net Income
Need a ready-made income statement template for your food truck?
Download a pre-built spreadsheet with industry-specific categories, formulas, and formatting.
Worked Example: Single Gourmet Burger Truck
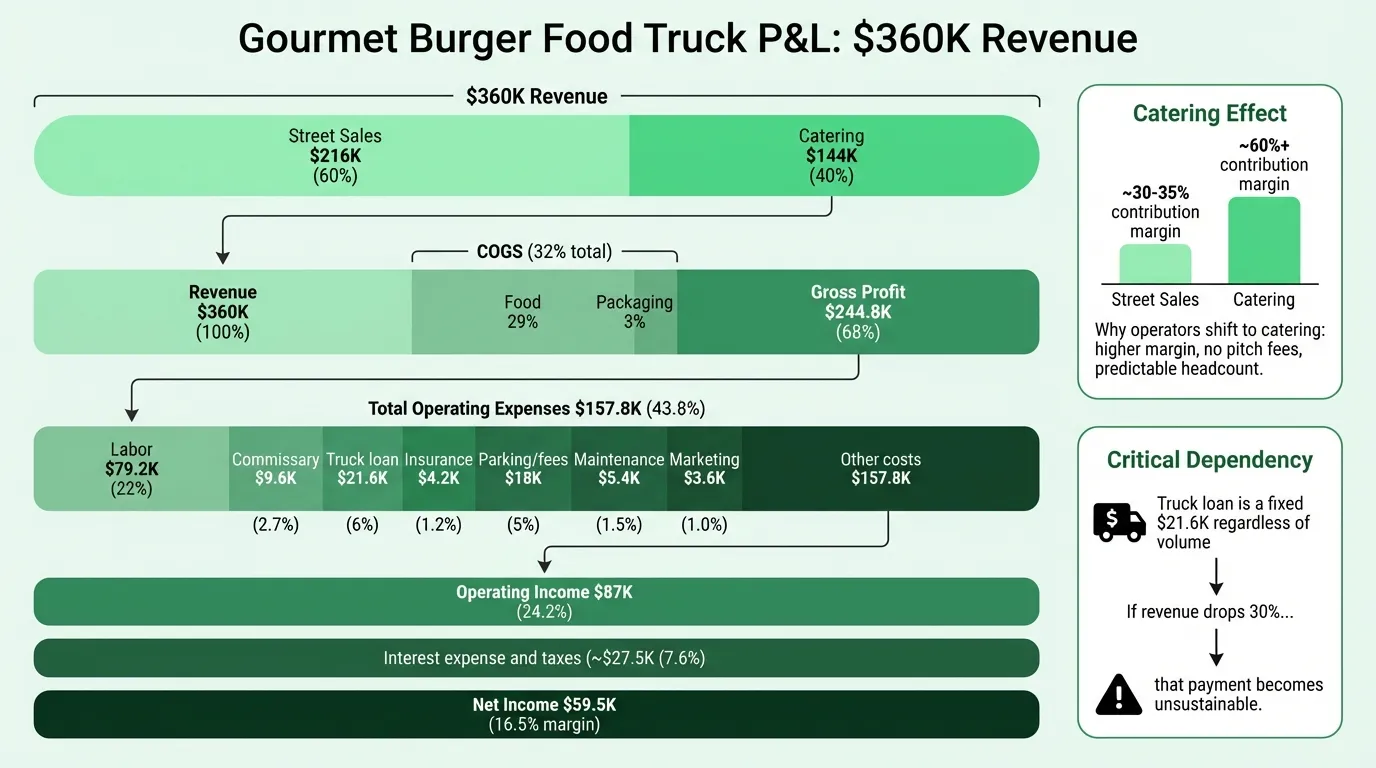
Here's a realistic annual income statement for an owner-operated gourmet burger food truck at $360,000 in annual revenue — slightly above average, reflecting a well-established route with growing catering business:
Revenue
| Line | Annual | % of Revenue |
|---|---|---|
| Street and event sales | $216,000 | 60% |
| Catering and private events | $144,000 | 40% |
| Total revenue | $360,000 | 100% |
Cost of Goods Sold
| Line | Annual | % of Revenue |
|---|---|---|
| Food cost (ingredients) | $104,400 | 29.0% |
| Packaging and paper goods | $10,800 | 3.0% |
| Total COGS | $115,200 | 32.0% |
Gross profit: $244,800 (68.0%)
A 68% gross margin is achievable for a burger truck keeping food costs at 29%. Note that this is the per-item margin before any labor, location, or overhead costs — it's not the take-home number.
Operating Expenses
| Line | Annual | % of Revenue |
|---|---|---|
| Owner labor (market rate) | $52,000 | 14.4% |
| Part-time staff (event help) | $21,600 | 6.0% |
| Payroll taxes | $5,580 | 1.6% |
| Total labor | $79,180 | 22.0% |
| Commissary rental | $9,600 | 2.7% |
| Truck loan payment | $21,600 | 6.0% |
| Fuel (driving + propane) | $10,800 | 3.0% |
| Commercial auto insurance | $2,400 | 0.7% |
| General liability insurance | $1,800 | 0.5% |
| Parking permits and lot fees | $7,200 | 2.0% |
| Event and pitch fees | $10,800 | 3.0% |
| Truck maintenance and repairs | $5,400 | 1.5% |
| POS system and processing fees | $3,600 | 1.0% |
| Permits and licenses | $1,800 | 0.5% |
| Marketing (social, signage) | $3,600 | 1.0% |
| Total operating expenses | $157,780 | 43.8% |
Operating income: $87,020 (24.2%)
Below Operating Income
| Line | Amount |
|---|---|
| Interest expense (truck loan) | ($4,320) |
| Pre-tax income | $82,700 |
| Self-employment tax (15.3% on ~$82K) | ($12,653) |
| Income tax (15% effective rate) | ($10,506) |
| Net income | $59,541 |
Net margin: 16.5%
This is above the 6–9% industry average because the operator is well-established, runs a 40% catering mix (higher margin), and keeps tight control on food costs and event fees. The $52,000 owner labor line is a market-rate salary assumption — many owner-operators don't track their own labor as an expense, which inflates apparent profit margins. Including it gives a cleaner picture of the business's actual economics.
The Catering Effect on Margins
The 40% catering mix in the example above is a meaningful driver of the above-average net margin. Here's why:
On a catering job at $144,000 annual revenue:
- Food cost at 25% (easier to control on known headcount): $36,000
- Labor at 15% (owner + 1 helper): $21,600
- No pitch fee, no parking permit
- Margin on catering: ~60%+ at the gross contribution level
On street sales at $216,000 annual revenue:
- Food cost at 31% (less predictable, some waste): $66,960
- Labor at 25% (more hours, more prep): $54,000
- Parking, fuel, pitch fees: $25,200
- Margin on street sales: ~30–35% contribution
Street sales cover fixed costs and build the brand. Catering generates the profit. Operators who understand this structure make deliberate decisions about which events to attend and where to direct their marketing energy.
What the Income Statement Reveals
Three specific things to read carefully on a food truck P&L:
Food cost trend. If food cost percentage is creeping up quarter over quarter, it's either a purchasing problem (supplier price increases passed through), a waste problem (over-prepping, spoilage), or a portioning problem (inconsistent serving sizes). At $360,000 in revenue, one percentage point of food cost is $3,600 per year.
Event fee ROI. Many operators track pitch fees paid versus revenue generated per event. A $1,500 festival pitch fee generating $8,000 in sales (18.75% cost ratio) is well within range. The same fee generating $3,500 in sales (42.9% cost ratio) erases the margin advantage of being there. This analysis requires tracking event performance separately — it doesn't come directly from the income statement, but the data to run it is there.
Truck loan as a percentage of revenue. The truck payment is a fixed cost that doesn't scale with revenue. At $360,000 in revenue, a $21,600 truck loan is 6% of revenue. If revenue dropped to $250,000, that same payment becomes 8.6% — a meaningful compression. Operators with higher debt service relative to revenue have less buffer during slow seasons. For a snapshot of what you own versus what you owe on the truck, see our food truck balance sheet example.
Food Truck vs. Restaurant: Key Income Statement Differences
| Line Item | Food Truck | Restaurant |
|---|---|---|
| Occupancy / rent | Commissary + parking + event fees (~8–12%) | Restaurant lease (~8–12%) |
| Vehicle costs | Truck loan + auto insurance + fuel (~8–10%) | None |
| Labor | 20–25% (smaller crew) | 30–35% (larger staff) |
| Net margin (average) | 6–9% | 3–5% (full service) |
| Fixed cost structure | More variable, location-by-location | More fixed, lease-driven |
| Startup capital required | $50,000–$200,000 | $175,000–$750,000+ |
The food truck's structural advantage is lower fixed occupancy cost and lower required startup capital. The disadvantage is revenue ceiling — a single truck has a hard limit on how many covers it can do in a day regardless of demand. The food truck break-even calculator shows how your daily cover count translates to profitability at different price points.
For a pre-built version in Excel, the Food Truck Income Statement Template includes food cost tracking, location-access cost categories, event-by-event revenue tracking, and the full P&L structure above. The Food Truck Budget Template complements it with forward-looking projections for seasonal planning. If you're projecting forward for a new truck or a second location, the template provides the baseline to model different volume and cost scenarios before committing capital.
Building the Habit
The operators who run profitable food trucks all share one habit: they close out every week with actual numbers, not estimates. Food cost percentage, event fee ROI, and total revenue by channel are the three numbers that, checked weekly, prevent margin surprises from compounding into quarterly problems.
The income statement is the monthly summary of those weekly numbers. Getting the weekly habits right makes the monthly statement easy to read — and makes it clear, weeks in advance, when a revenue or cost trend needs attention before it becomes a real problem.
Last updated: March 24, 2026
Frequently Asked Questions
Related Articles
Coffee Shop Income Statement Example: Revenue, Costs, and Margins
A coffee shop income statement example with beverage cost benchmarks, labor targets, prime cost rules, and a worked P&L for an independent café doing $480K/year.
Daycare Income Statement Example: Revenue, Costs, and Margins
A daycare income statement example with tuition revenue, CACFP reimbursements, staff cost benchmarks, and a worked P&L for a 50-child childcare center.
Healthcare Income Statement Example: Revenue, Expenses, and Margins
A healthcare income statement example covering net patient revenue, contractual adjustments, expense benchmarks, and operating margin targets for providers.
Healthcare Pro Forma Example: What to Include and How to Build One
A practical healthcare pro forma example — covering revenue projections, payer mix, expense benchmarks, and a worked model for a new medical practice or service line.
Hotel Pro Forma Example: What to Include and How to Build One
A practical hotel pro forma example — covering RevPAR, GOP, undistributed expenses, FF&E reserves, and a worked model for acquisition or development underwriting.
Manufacturing Income Statement Example: Line Items and Benchmarks
A manufacturing income statement example with COGM schedule, gross margin benchmarks by subsector, and a worked P&L for a precision parts manufacturer.