Hotel Pro Forma Example: What to Include and How to Build One
A practical hotel pro forma example — covering RevPAR, GOP, undistributed expenses, FF&E reserves, and a worked model for acquisition or development underwriting.
A hotel pro forma is not a standard real estate model. Hotels are operating businesses that happen to own or lease real property — and the financial model reflects that. Where a multifamily or office pro forma moves from rent to NOI in a few steps, a hotel pro forma works through multiple operating layers before arriving at a number you can capitalize.
Understanding that structure is what separates a credible hotel acquisition model from a back-of-envelope estimate.
This post covers the components of a hotel pro forma, the benchmarks that inform realistic inputs, and a worked example for a 60-room limited-service upscale hotel acquisition.
Why Hotel Pro Formas Work Differently
Hotels generate revenue from multiple departments — rooms, food and beverage, spa, parking, meeting space — each with its own revenue line and its own operating costs. The industry's accounting standard for organizing this is the Uniform System of Accounts for the Lodging Industry (USALI), which defines how every line item should be classified and where it appears in the model.
The USALI structure creates a cascading P&L:
- Departmental revenues and expenses — each operating department nets out to a departmental profit
- Undistributed operating expenses — costs shared across departments (administrative and general, sales and marketing, property operations, utilities, IT)
- Gross Operating Profit (GOP) — revenue minus all operating costs
- Fees and fixed charges — management fees, franchise fees, property taxes, insurance, FF&E reserve
- Net Operating Income (NOI) — the final pre-financing income figure
Every layer has industry benchmarks. When an investor or lender reviews a hotel pro forma, they check each line against what's normal for the property type — and any deviation requires explanation. The hotel accounting guide covers the USALI framework in detail, including how each layer is structured and why.
Key Metrics in Every Hotel Pro Forma
Before building the financial waterfall, the pro forma establishes operating metrics that drive revenue projections:
Occupancy rate — the percentage of available rooms sold on average across the year. A 100-room hotel running 65% occupancy sells 23,725 room nights per year.
ADR (Average Daily Rate) — average revenue per occupied room. A hotel doing $150 ADR at 65% occupancy generates $3,558,750 in rooms revenue annually.
RevPAR (Revenue Per Available Room) — ADR × Occupancy Rate. RevPAR is the single most-used performance metric in hospitality because it captures both pricing power and occupancy simultaneously. $150 ADR × 65% occupancy = $97.50 RevPAR.
GOPPAR (GOP Per Available Room) — GOP divided by available room nights. Measures operational profitability per room, independent of financing.
2024–2025 Benchmark Context
Per STR and CoStar data, U.S. hotel performance in 2024–2025:
| Metric | U.S. Average (2024–2025) |
|---|---|
| Occupancy | 62–63% |
| ADR | ~$162 |
| RevPAR | ~$100–103 |
| GOP margin | ~35% |
| Labor (% of revenue) | ~34% |
Performance varies significantly by segment and market. Luxury resorts in coastal gateway cities run 70–75% occupancy at $300–600 ADR. Economy properties in secondary markets run 52–58% occupancy at $80–110 ADR. When building a hotel pro forma, use your competitive set's actual data — not national averages.
What a Hotel Pro Forma Includes
Rooms Revenue
Rooms revenue is the product of occupied room nights and ADR:
Rooms revenue = Available rooms × 365 × Occupancy rate × ADR
For a 60-room hotel at 68% occupancy and $165 ADR:
- Available room nights: 60 × 365 = 21,900
- Occupied room nights: 21,900 × 68% = 14,892
- Rooms revenue: 14,892 × $165 = $2,457,180
The pro forma projects occupancy and ADR separately, then models their growth over a 5–10 year hold period. Conservative underwriting assumes 2–3% annual ADR growth; aggressive assumptions above 4% require market justification. For guidance on building the revenue projections that feed these assumptions, see the hotel sales forecast example.
Other Revenue Departments
Depending on property type, additional revenue lines include:
- Food and beverage — restaurant, bar, room service, banquets, catering (significant for full-service; minimal for select-service)
- Meeting and event space — conference room rentals, audiovisual charges, setup fees
- Parking — daily or monthly rates; especially meaningful in urban locations
- Spa and fitness — treatment revenue, memberships, product sales
- Resort and ancillary fees — mandatory resort fees, pet fees, early/late checkout charges
For limited-service and select-service hotels, rooms typically represent 85–95% of total revenue. Full-service and resort properties commonly generate 60–75% of revenue from rooms, with F&B contributing 15–25%.
Departmental Expenses
Each revenue department has direct costs assigned to it:
Rooms department expenses include housekeeping labor and supplies, front desk staffing, reservation costs, amenities, and OTA commissions. Rooms department profit margins typically run 65–75% of rooms revenue for well-managed properties.
F&B department expenses include food and beverage COGS (25–35% of F&B revenue), kitchen and service labor, and supplies. F&B profit margins are slim — many full-service hotels break even or run modest losses on F&B, accepting it as a guest service cost that supports room rate and group business.
Undistributed Operating Expenses
These costs are shared across departments and expressed as a percentage of total revenue:
| Expense | Typical Range |
|---|---|
| Administrative and General (A&G) | 6–9% of total revenue |
| Sales and Marketing (incl. OTA commissions) | 5–8% of total revenue |
| Property Operations and Maintenance | 4–6% of total revenue |
| Utilities | 4–7% of total revenue |
| Information Technology | 1–2% of total revenue |
Gross Operating Profit (GOP)
GOP is what remains after all departmental and undistributed expenses. Industry benchmark: 35–45% GOP margin for full-service properties; 40–50% for select-service limited-service hotels with lower F&B costs.
GOP margins have been under pressure — per STR data cited by Cloudbeds, the U.S. average GOP margin was approximately 35.4% in 2024, down from prior years due to persistent labor cost inflation. HVS data through August 2025 shows continued margin compression across all hotel segments.
Fees and Fixed Charges
Below GOP, the pro forma deducts fees and fixed charges:
Management fee: A base management fee of 2–4% of total revenue is standard for third-party managed hotels. Incentive fees (triggered by exceeding GOP thresholds) add another 10–15% of GOP above the threshold. Independent owner-operators managing their own property should still model a management fee — any buyer or lender will underwrite one.
Franchise fees: Branded hotels pay royalty fees (4–6% of rooms revenue), marketing/program fees (1–3%), and reservation fees. Total brand fees commonly run 8–12% of rooms revenue for major flags.
Property taxes, insurance: Varies by location; typically 3–6% of total revenue combined.
FF&E reserve: The industry standard capital set-aside is 3–5% of gross revenue. Most lenders require a minimum of 3.5–4% in loan documents. Branded hotels often have brand-mandated property improvement plan (PIP) requirements that effectively define the minimum reserve. Don't omit this line — it's real cash that cannot be distributed.
Net Operating Income (NOI)
NOI = GOP − Management fees − Franchise fees − Property taxes − Insurance − FF&E reserve
NOI is the figure applied to a cap rate to determine property value. It's also the figure lenders use to calculate DSCR.
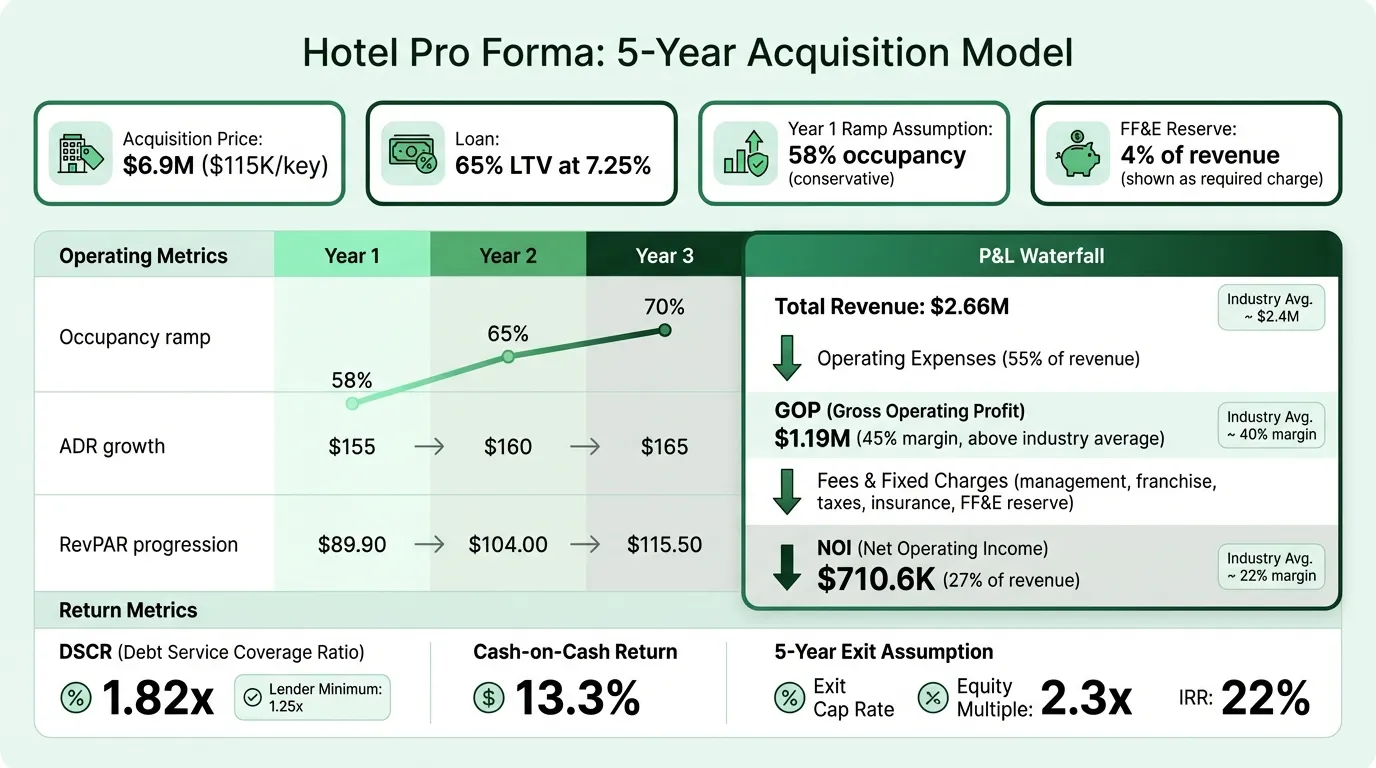
Worked Example: 60-Room Upscale Limited-Service Acquisition
This model assumes a stabilizing secondary-market hotel — year 1 is below stabilized occupancy, with ramp to full performance by year 3.
Acquisition Assumptions
- Purchase price: $6,900,000 ($115,000 per key)
- Rooms: 60
- Market: Secondary market, upscale limited-service
- Loan: 65% LTV at 7.25%, 25-year amortization
- Equity invested: $2,415,000
Operating Assumptions
| Metric | Year 1 | Year 2 | Year 3 |
|---|---|---|---|
| Occupancy | 58% | 65% | 70% |
| ADR | $155 | $160 | $165 |
| RevPAR | $89.90 | $104.00 | $115.50 |
| Rooms revenue | $1,967,370 | $2,277,600 | $2,529,450 |
| Other revenue (parking, ancillary) | $98,369 | $113,880 | $126,473 |
| Total Revenue | $2,065,739 | $2,391,480 | $2,655,923 |
Expense Model (Year 3 Stabilized)
| Line Item | Amount | % of Revenue |
|---|---|---|
| Rooms dept. expenses (30% of rooms revenue) | $758,835 | 28.6% |
| A&G | $212,474 | 8.0% |
| Sales and Marketing | $159,355 | 6.0% |
| Property Operations and Maintenance | $132,796 | 5.0% |
| Utilities | $159,355 | 6.0% |
| IT/Technology | $39,839 | 1.5% |
| Total Operating Expenses | $1,462,654 | 55.1% |
| Gross Operating Profit | $1,193,269 | 44.9% |
Below-GOP Deductions (Year 3)
| Item | Amount | % of Revenue |
|---|---|---|
| Management fee (3% of total revenue) | $79,678 | 3.0% |
| Franchise fees (est. 6% of rooms revenue) | $151,767 | 5.7% |
| Property taxes | $110,000 | 4.1% |
| Insurance | $35,000 | 1.3% |
| FF&E reserve (4% of total revenue) | $106,237 | 4.0% |
| Total Fees and Fixed Charges | $482,682 | 18.2% |
| Net Operating Income | $710,587 | 26.8% |
Return Metrics (Year 3 Stabilized)
| Metric | Value |
|---|---|
| Cap rate at purchase price | 10.3% |
| Annual debt service ($4,485,000 loan) | ~$389,400 |
| Cash flow before tax | ~$321,187 |
| Cash-on-cash return | 13.3% |
| DSCR | 1.82x |
At a 5-year exit assuming 2.5% annual RevPAR growth and a 9.0% exit cap rate (modest compression from a 10.3% going-in cap):
| Exit Metric | Value |
|---|---|
| Year 5 NOI (estimated) | ~$760,000 |
| Exit value at 9.0% cap | ~$8,445,000 |
| Selling costs (3%) | (~$253,000) |
| Net sale proceeds | ~$8,192,000 |
| Remaining loan balance | ~($4,100,000) |
| Equity from sale | ~$4,092,000 |
| Total distributions (5 years) | ~$1,400,000 |
| Equity multiple | ~2.3x |
| IRR | ~22% |
This deal lands in the value-add IRR range, reflecting the occupancy ramp risk in year 1. The DSCR of 1.82x at stabilization provides substantial debt coverage cushion. Validate whether the deal pencils at different occupancy levels with the hotel break-even calculator.
Need a ready-made pro forma template for your hotel?
Download a pre-built spreadsheet with industry-specific categories, formulas, and formatting.
Three Inputs That Drive the Model
1. Stabilized occupancy assumption. Whether you assume 65% or 72% occupancy at stabilization produces a meaningful RevPAR difference — and compounds through every operating line. Back your occupancy assumption with comp set data from STR or CoStar, not intuition. Lenders will ask.
2. ADR growth rate. ADR growth of 2% annually vs. 4% compounded over a 10-year hold creates a large gap in exit NOI. Conservative underwriting uses 2–2.5%; aggressive assumptions above 3% need market justification.
3. Exit cap rate. The sale price depends almost entirely on the cap rate applied to exit-year NOI. Buying at a 10.3% cap and assuming a 7% exit is a strong assumption that requires a thesis for why cap rate compression will occur. Conservative underwriting holds the exit cap at or above the going-in cap — the deal should pencil even if the market doesn't reward compression.
The FF&E Reserve: Why It Can't Be Skipped
Hotel investors sometimes undersize or omit the FF&E reserve to improve projected returns. This is a mistake that compounds over time.
Hotels require continuous investment in physical condition. Soft goods (linens, carpets, upholstery) have 5–7 year replacement cycles. Technology (PMS, key systems, in-room entertainment) cycles every 5–8 years. Exterior and common area renovations happen every 10–15 years. A 100-room hotel not reserving 3–5% of revenue annually is accumulating deferred maintenance — which shows up as an acquisition discount when you go to sell.
The pro forma should model the FF&E reserve as a real operating expense. Most lenders require it as a loan covenant. Brand PIP requirements enforce it for franchised properties. Independent hotels need to self-impose the discipline.
Using the Pro Forma for Lender Packages
Hotel acquisition loans — whether SBA 7(a), SBA 504, conventional commercial, or CMBS — require a pro forma as part of the underwriting package. Lenders focus on:
- DSCR at stabilized NOI — most commercial lenders require 1.25x minimum; SBA programs may be slightly more flexible for qualifying properties
- LTV and per-key value — the per-room acquisition cost relative to comparable sales
- Ramp-up timing — lenders want to see a conservative year 1 assumption that doesn't rely on immediate full occupancy
Walking into a lender meeting with a model that shows 80% occupancy in year 1 for a hotel that currently runs 45% signals either inexperience or optimism. A conservative ramp model that still covers debt service is far more credible. For the balance sheet data lenders will review alongside the pro forma, the hotel balance sheet example covers what they look for — including DSCR, equity position, and FF&E reserve adequacy.
How This Fits the Broader Financial Picture
The pro forma is the underwriting tool — it covers the acquisition or development decision. Once the hotel is operating, performance tracking shifts to the monthly and annual income statement against budget, RevPAR index vs. competitive set, and trailing 12-month GOPPAR.
The Hotel Pro Forma Template is built for acquisition and development underwriting: a 10-year projection with USALI-structured departmental revenue and expense lines, GOP and NOI waterfall, and cap rate and IRR outputs. For ongoing financial management after acquisition, the Hotel Income Statement Template and Hotel Cash Flow Template cover historical tracking.
If you're also evaluating hotels in the context of broader hospitality finance decisions, the Hotel Budget Template is the planning tool that sits alongside the pro forma for ongoing annual operations.
A hotel pro forma built on competitive set data, a realistic occupancy ramp, appropriate expense benchmarks, and a genuine FF&E reserve won't always show great returns — but it will accurately show which deals are worth pursuing before you've committed capital. Create investor-ready presentations from your pro forma — Deckary.
Last updated: March 24, 2026
Frequently Asked Questions
Related Articles
Coffee Shop Income Statement Example: Revenue, Costs, and Margins
A coffee shop income statement example with beverage cost benchmarks, labor targets, prime cost rules, and a worked P&L for an independent café doing $480K/year.
Daycare Income Statement Example: Revenue, Costs, and Margins
A daycare income statement example with tuition revenue, CACFP reimbursements, staff cost benchmarks, and a worked P&L for a 50-child childcare center.
Food Truck Income Statement Example: Line Items and Benchmarks
A food truck income statement example with food cost benchmarks, unique line items like commissary and pitch fees, and a worked P&L for a single-truck operation.
Healthcare Income Statement Example: Revenue, Expenses, and Margins
A healthcare income statement example covering net patient revenue, contractual adjustments, expense benchmarks, and operating margin targets for providers.
Healthcare Pro Forma Example: What to Include and How to Build One
A practical healthcare pro forma example — covering revenue projections, payer mix, expense benchmarks, and a worked model for a new medical practice or service line.
Manufacturing Income Statement Example: Line Items and Benchmarks
A manufacturing income statement example with COGM schedule, gross margin benchmarks by subsector, and a worked P&L for a precision parts manufacturer.