Coffee Shop Income Statement Template
See exactly where your coffee shop makes and loses money — with an income statement pre-loaded for cafes, espresso bars, and roasters.
What's Inside This Coffee Shop Income Statement Template
This template includes 4 worksheets, each designed for a specific part of your coffee shop financial workflow:
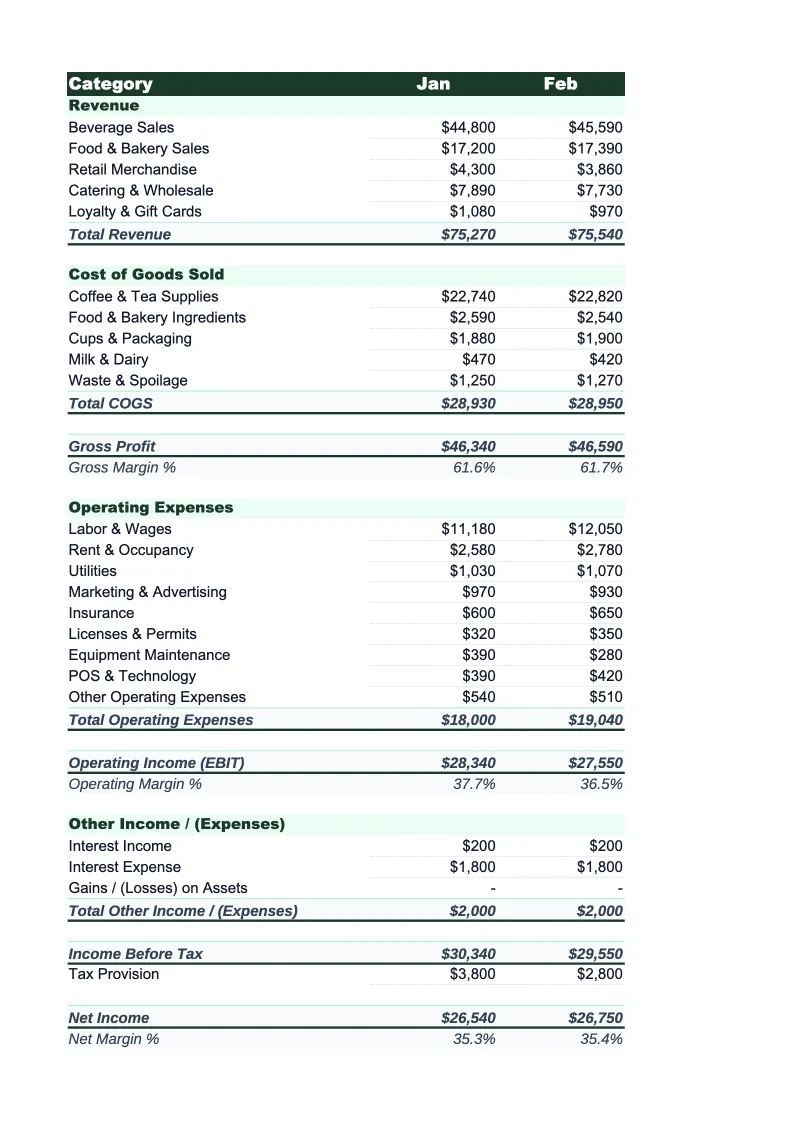
Monthly Income Statement
The core P&L worksheet for a single month.
Annual Summary
A 12-month income statement that pulls from each monthly sheet and displays the full year in one view.
Revenue Breakdown
A dedicated sheet for analyzing revenue by channel and product category.
Dashboard
A one-page visual summary of your coffee shop's key financial metrics.
Coffee Shop Income Statement Template Features
- Revenue split by espresso, drip, food, wholesale, and catering channels
- Beverage cost percentage auto-calculated vs. 25–35% industry benchmark
- Labor tracked by barista, management, and total benefits line
- Gross profit, operating income, and net income auto-calculated
- 12-month annual summary with full-year margin percentages
- Dashboard with beverage cost %, labor %, and net margin charts
How to Use This Coffee Shop Income Statement Spreadsheet
Start with the Monthly Income Statement sheet and review the pre-loaded categories. Most of the revenue and expense line items are ready to use — you'll likely want to rename or consolidate a few to match your specific setup, like separating cold brew from iced drinks, or adding a line for merchandise if you sell branded gear. Every cell is unlocked, so adjustments take a few minutes. Download the file and open it in Excel or Google Sheets — no macros or plugins required.
Enter last month's figures first before projecting forward. Pull your POS report for revenue by category and your bank statement for expenses — your rent, utility bills, payroll records, and supplier invoices will cover most of the cost side. Beverage cost is the trickiest to pin down accurately, so if you don't track it precisely, use your bean and dairy invoices as a proxy. Fill in one month completely before copying the structure forward. The Annual Summary and Dashboard sheets update automatically.
15 minutes from download to your first income statement
Download the template, plug in last month's numbers, and see your coffee shop's full financial picture — revenue by channel, beverage cost %, labor %, and net margin.
Why Every Coffee Shop Needs an Income Statement Template
Coffee shops operate on thin net margins — typically 5–15% — despite strong gross margins of 60–70%. The gap exists because labor, rent, and equipment costs are high relative to the product. What this means in practice is that a 2% increase in beverage cost or a few extra unscheduled labor hours per week can wipe out weeks of profit. Without a structured income statement, those shifts are nearly invisible until they show up as a cash shortfall at the end of the month.
A well-structured coffee shop income statement separates revenue by channel — espresso drinks, drip coffee, food, wholesale, and catering — and breaks COGS into beverage cost and food cost independently. This matters because the margin profile is completely different: a latte has a beverage cost of roughly 20–30% but food items like pastries sourced from a bakery might run 40–50% depending on your supplier. Mixing them into a single COGS line hides which part of your menu is actually making money. Labor should be split between baristas and management, since barista hours flex with volume while management is largely fixed.
Coffee Shop Industry at a Glance
Financial templates built for coffee shops and cafes — from single-location espresso bars to multi-location roasters. Pre-loaded with beverage cost categories, wholesale account structures, and industry KPIs.
Revenue Drivers
- Espresso & specialty drinks
- Drip coffee & batch brew
- Food & pastry sales
- Wholesale bean sales
- Office coffee service accounts
- Catering & event service
Key Cost Categories
- Coffee beans & specialty ingredients (COGS)
- Dairy & alternative milks
- Food/pastry COGS
- Labor
- Rent & occupancy
- Equipment maintenance & repair
- Packaging & supplies
- Marketing
Typical Margins
Gross: 60-70% · Net: 5-15%
Seasonality
Strongest in fall and winter when hot drink demand peaks; slower in summer unless cold brew and iced drink sales are high. Morning rush (6–10am) drives the majority of daily revenue.
Key Performance Indicators
Coffee Shop Income Statement Template FAQ
More Coffee Shop Templates
Coffee Shop Balance Sheet Template for Excel
$29
Coffee Shop Budget Template for Excel
$29
Coffee Shop Business Plan Template for Excel
$39
Coffee Shop Cash Flow Template for Excel
$29
Coffee Shop Expense Tracker Template for Excel
$29
Coffee Shop Financial Model Template for Excel
$29
Coffee Shop Invoice Template for Excel
$29
Coffee Shop KPI Dashboard Template for Excel
$29
Coffee Shop P&L Template for Excel
$29
Coffee Shop Pro Forma Template for Excel
$29
Coffee Shop Project Budget Template for Excel
$29
Coffee Shop Sales Forecast Template for Excel
$29
Coffee Shop Valuation Template for Excel
$29
More Income Statement Templates
Accounting Firm Income Statement Template for Excel
$29
Auto Repair Income Statement Template for Excel
$29
Car Wash Income Statement Template for Excel
$29
Church Income Statement Template for Excel
$29
Cleaning Service Income Statement Template for Excel
$29
Construction Income Statement Template for Excel
$29
Coffee Shop Income Statement Template
$29