Manufacturing Income Statement Example: Line Items and Benchmarks
A manufacturing income statement example with COGM schedule, gross margin benchmarks by subsector, and a worked P&L for a precision parts manufacturer.
Manufacturing income statements look different from retail or service P&Ls. The difference isn't cosmetic — it reflects the fact that manufacturers produce what they sell, which creates an entirely different cost structure. Three inventory accounts instead of one. A supporting schedule to calculate production costs. Overhead that must be allocated to units, not expensed as incurred.
Understanding that structure — and what the benchmarks should look like at each layer — is the starting point for reading any manufacturing P&L.
Why Manufacturing Is Different: Three Inventory Accounts
A retailer carries one inventory account: merchandise held for sale. A manufacturer carries three:
- Raw materials — inputs not yet put into production
- Work-in-process (WIP) — partially completed units on the production floor
- Finished goods — completed units ready for sale
All three accounts appear on the manufacturing balance sheet. All three affect how COGS flows through the income statement. When raw material prices spike or a production run gets delayed, the impact shows up in inventory balances before it appears in COGS — which is why lenders and investors watch inventory turns alongside the income statement.
The second difference is that manufacturers don't buy finished goods for resale. They assemble cost components into a product. To know what that product cost to make, you need a separate calculation: the Cost of Goods Manufactured (COGM) schedule.
The Cost of Goods Manufactured Schedule
The COGM schedule is a supporting document — it doesn't appear on the income statement itself, but it produces the number that feeds into COGS. Its structure:
Step 1: Calculate Direct Materials Used
| Amount | |
|---|---|
| Beginning raw materials inventory | $150,000 |
| + Raw materials purchased | $1,140,000 |
| = Raw materials available | $1,290,000 |
| − Ending raw materials inventory | ($165,000) |
| = Direct materials used in production | $1,125,000 |
Step 2: Add Direct Labor and Manufacturing Overhead
| Amount | |
|---|---|
| Direct materials used | $1,125,000 |
| + Direct labor | $405,000 |
| + Manufacturing overhead | $375,000 |
| = Total manufacturing cost | $1,905,000 |
Step 3: Adjust for WIP
| Amount | |
|---|---|
| Total manufacturing cost | $1,905,000 |
| + Beginning WIP inventory | $125,000 |
| − Ending WIP inventory | ($135,000) |
| = Cost of goods manufactured | $1,895,000 |
This is the cost of goods completed during the period. It's not the same as COGS yet — finished goods inventory levels affect what was actually sold.
From COGM to COGS
The final step connects production output to sales:
| Amount | |
|---|---|
| Beginning finished goods inventory | $195,000 |
| + Cost of goods manufactured | $1,895,000 |
| = Cost of goods available for sale | $2,090,000 |
| − Ending finished goods inventory | ($200,000) |
| = Cost of goods sold | $1,890,000 |
If finished goods inventory builds (ending > beginning), COGS is lower than COGM — production outpaced sales. If inventory draws down, COGS exceeds COGM — the company is selling through prior-period production. Both patterns appear on the balance sheet before showing up in COGS trends.
What Goes Into Manufacturing Overhead
Manufacturing overhead is every indirect production cost — everything in the factory that isn't direct materials or direct labor. It's applied to products using a predetermined overhead rate, then reconciled at period-end.
Common overhead components:
| Category | Examples |
|---|---|
| Indirect labor | Factory supervisors, quality inspectors, maintenance workers, production schedulers |
| Equipment depreciation | Machinery, tooling, production line equipment (not corporate IT) |
| Factory utilities | Electricity, natural gas, water consumed in production |
| Facility costs | Factory lease or building depreciation, property taxes on production facilities |
| Factory insurance | Property insurance on plant and equipment, workers' comp for production staff |
| Indirect materials | Lubricants, cleaning supplies, machine consumables that can't be traced to a unit |
The overhead rate is calculated as: Total Manufacturing Overhead ÷ Allocation Base. The allocation base can be direct labor hours, machine hours, or direct labor dollars depending on what drives overhead in that facility. Heavily automated plants should use machine hours — using labor hours in an automated facility misrepresents actual cost drivers. For a deeper walkthrough of allocation methods including activity-based costing, see our manufacturing accounting guide.
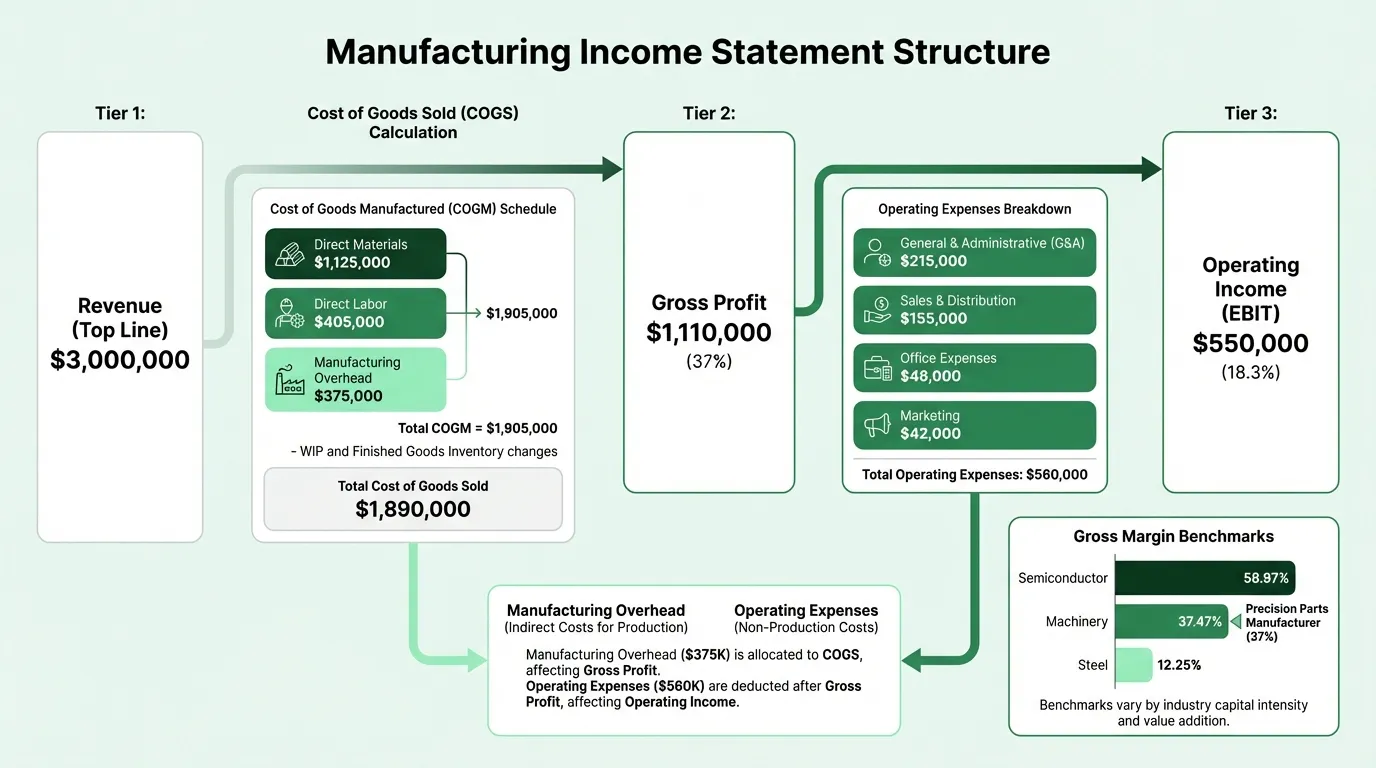
Gross Margin Benchmarks by Manufacturing Subsector
Gross margins vary dramatically across manufacturing. A semiconductor company and a steel mill are both manufacturers, but their cost structures have almost nothing in common.
From NYU Stern's January 2026 data (derived from U.S. public company SEC filings):
| Manufacturing Subsector | Gross Margin | Operating Margin |
|---|---|---|
| Semiconductor | 58.97% | 40.37% |
| Computers/Peripherals | 38.36% | 24.96% |
| Machinery | 37.47% | 16.78% |
| Chemical (Specialty) | 35.12% | 12.85% |
| Electrical Equipment | 31.82% | 10.90% |
| Electronics (General) | 26.76% | 11.80% |
| Packaging & Container | 24.27% | 10.03% |
| Food Processing | 23.23% | 11.00% |
| Aerospace/Defense | 17.48% | 9.80% |
| Auto Parts | 15.84% | 6.37% |
| Steel | 12.25% | 4.50% |
| Auto & Truck | 10.41% | 3.16% |
The pattern: high-IP and specialty manufacturing — semiconductors, specialized machinery, specialty chemicals — posts gross margins of 30–60%. Commodity and capital-intensive heavy manufacturing — steel, automotive OEMs, basic materials — operates on 10–25%. The difference reflects pricing power and the relative weight of raw material input costs.
Comparing your gross margin against industry-wide manufacturing averages is misleading. Benchmark against your specific subsector.
Need a ready-made income statement template for your manufacturing?
Download a pre-built spreadsheet with industry-specific categories, formulas, and formatting.
Operating Expenses: Period Costs Below the Line
After gross profit, operating expenses appear. These are period costs — they're expensed as incurred, not capitalized into inventory. This is a critical distinction.
What belongs in operating expenses (not COGS):
- Sales salaries, commissions, and travel
- Marketing and advertising
- G&A salaries and executive compensation
- Office rent, utilities, and facilities (non-production)
- Corporate depreciation (non-production assets)
- Professional fees: accounting, legal, HR
- R&D expenses (typically below operating income for manufacturers)
A common mistake: including corporate salaries or office expenses in manufacturing overhead. That inflates COGS, understates gross margin, and produces a distorted picture of production efficiency.
Operating income (EBIT) = Gross Profit − Operating Expenses
Worked Example: Precision Parts Manufacturer
Here's a realistic annual income statement for a $3M precision machinery component manufacturer:
Revenue
| Line | Annual | % of Revenue |
|---|---|---|
| Net revenue | $3,000,000 | 100% |
Cost of Goods Sold
| Line | Amount | % of Revenue |
|---|---|---|
| Direct materials used | $1,125,000 | 37.5% |
| Direct labor | $405,000 | 13.5% |
| Manufacturing overhead | $375,000 | 12.5% |
| Total manufacturing cost | $1,905,000 | 63.5% |
| Adjust for WIP change (net) | ($10,000) | — |
| Cost of goods manufactured | $1,895,000 | — |
| Adjust for finished goods change (net) | ($5,000) | — |
| Cost of goods sold | $1,890,000 | 63.0% |
Gross profit: $1,110,000 (37.0%)
This is consistent with the NYU Stern machinery sector benchmark of 37.47%.
Manufacturing Overhead Detail
| Component | Amount | % of Revenue |
|---|---|---|
| Indirect labor (supervisors, QC, maintenance) | $145,000 | 4.8% |
| Equipment depreciation | $95,000 | 3.2% |
| Factory utilities | $65,000 | 2.2% |
| Factory lease | $45,000 | 1.5% |
| Factory insurance | $15,000 | 0.5% |
| Indirect materials | $10,000 | 0.3% |
| Total manufacturing overhead | $375,000 | 12.5% |
Operating Expenses
| Line | Amount | % of Revenue |
|---|---|---|
| G&A salaries | $215,000 | 7.2% |
| Sales salaries and commissions | $155,000 | 5.2% |
| Office rent and utilities | $48,000 | 1.6% |
| Marketing and advertising | $42,000 | 1.4% |
| Professional fees (accounting, legal) | $42,000 | 1.4% |
| Corporate depreciation | $28,000 | 0.9% |
| Other G&A | $30,000 | 1.0% |
| Total operating expenses | $560,000 | 18.7% |
Operating income (EBIT): $550,000 (18.3%)
Below Operating Income
| Line | Amount | % |
|---|---|---|
| Interest expense (equipment financing) | ($48,000) | 1.6% |
| Pre-tax income | $502,000 | 16.7% |
| Income tax (21%) | ($105,420) | — |
| Net income | $396,580 | 13.2% |
This manufacturer is performing above the 16.78% operating margin benchmark for the machinery sector — a sign of either strong pricing, lean overhead, or both. The 37% gross margin lands almost exactly at the sector average, suggesting production costs are well-controlled.
The Two Ratios Manufacturing Operators Watch
Prime cost — direct materials plus direct labor — is the cost most directly traceable to what you make. In this example: $1,125,000 + $405,000 = $1,530,000, or 51% of revenue. As a percentage of COGS, it's 80.9%. The remainder is manufacturing overhead at 19.1%.
Prime cost sets your pricing floor. If a customer wants a price that puts them at 48% of your revenue, that job loses money before overhead. Knowing your prime cost per product or product line is how you avoid underpriced contracts.
Conversion cost — direct labor plus manufacturing overhead — is the cost to convert raw materials into finished goods. In this example: $405,000 + $375,000 = $780,000. This ratio matters when evaluating automation investments: if a machine reduces direct labor by $80,000 per year and costs $300,000, the payback is less than four years purely on conversion cost savings, before accounting for throughput improvements. Use our manufacturing profit margin calculator to model how conversion cost changes affect your gross and net margins.
Common Income Statement Mistakes in Manufacturing
Mixing period costs into COGS. Office rent, corporate salaries, and marketing expenses are period costs. They belong in operating expenses, below gross profit. Including them in manufacturing overhead inflates COGS and understates gross margin — making production look less efficient than it is.
Ignoring WIP inventory. If your production floor has partially completed units at month end and you don't track them, your COGM calculation is wrong. The error self-corrects over two periods, but each period's reported margins will be distorted.
Forgetting to capitalize overhead into inventory. Under GAAP (ASC 330), inventory must include a proportional share of manufacturing overhead, not just materials and direct labor. Small manufacturers who expense all overhead as incurred are understating inventory on the balance sheet and overstating COGS in the current period.
Using labor hours as the overhead rate in an automated plant. If a $2M CNC machine runs mostly unattended, allocating overhead based on the handful of operator hours misrepresents what's driving cost. Machine hours or a standard cost system better reflects the actual cost structure.
Using the Income Statement for Pricing and Capacity Decisions
A manufacturing income statement isn't just a financial reporting document — it's your cost structure in spreadsheet form.
The gross margin percentage tells you how much room you have before overhead and profit. A company running at 37% gross margin can absorb $600,000 in operating expenses on $3M in revenue and still generate 15%+ operating margins. The same cost structure on $2M in revenue produces 7% operating margins — or a loss if fixed overhead doesn't scale down.
This is why revenue growth decisions in manufacturing need to be analyzed against COGM, not just top-line growth. Taking on a large contract at lower-than-normal margins can improve gross profit in absolute dollars while compressing the ratio — and if fixed overhead doesn't change, the operating leverage works against you. Modeling these scenarios before committing is what a manufacturing budget with volume-based cost projections is built for.
For a pre-built version in Excel, the Manufacturing Income Statement Template includes the COGM schedule, the three-inventory-account COGS calculation, and gross margin tracking by period. If you're managing production budgets alongside profitability, the Manufacturing Budget Template provides the planning layer to set targets before the month starts and compare actuals against them line by line.
Last updated: March 24, 2026
Frequently Asked Questions
Related Articles
Coffee Shop Income Statement Example: Revenue, Costs, and Margins
A coffee shop income statement example with beverage cost benchmarks, labor targets, prime cost rules, and a worked P&L for an independent café doing $480K/year.
Daycare Income Statement Example: Revenue, Costs, and Margins
A daycare income statement example with tuition revenue, CACFP reimbursements, staff cost benchmarks, and a worked P&L for a 50-child childcare center.
Food Truck Income Statement Example: Line Items and Benchmarks
A food truck income statement example with food cost benchmarks, unique line items like commissary and pitch fees, and a worked P&L for a single-truck operation.
Healthcare Income Statement Example: Revenue, Expenses, and Margins
A healthcare income statement example covering net patient revenue, contractual adjustments, expense benchmarks, and operating margin targets for providers.
Healthcare Pro Forma Example: What to Include and How to Build One
A practical healthcare pro forma example — covering revenue projections, payer mix, expense benchmarks, and a worked model for a new medical practice or service line.
Hotel Pro Forma Example: What to Include and How to Build One
A practical hotel pro forma example — covering RevPAR, GOP, undistributed expenses, FF&E reserves, and a worked model for acquisition or development underwriting.