Healthcare Income Statement Example: Revenue, Expenses, and Margins
A healthcare income statement example covering net patient revenue, contractual adjustments, expense benchmarks, and operating margin targets for providers.
Healthcare income statements follow a structure you won't find in most other industries. A retailer starts with sales. A manufacturer starts with revenue minus production costs. A healthcare provider starts with gross charges — then subtracts contractual adjustments that can reduce that number by 50–70% before arriving at anything resembling real revenue.
Understanding this structure is the prerequisite for reading any healthcare P&L, whether for a 500-bed hospital or a three-physician practice.
Why Healthcare Revenue Reporting Is Different
The core complexity is the chargemaster. Every healthcare provider maintains a "chargemaster" or list of standard charges for every service — an MRI, a routine office visit, an appendectomy. These list prices bear little relationship to what providers actually collect.
Here's why: Medicare and Medicaid pay fixed rates set by government formula, not chargemaster prices. Commercial insurers negotiate discounted rates. The result is that the difference between what a provider bills and what it receives — called contractual adjustments — is massive.
For a typical hospital, the revenue flow looks like this:
| Line | Amount | % of Gross |
|---|---|---|
| Gross patient service charges | $10,000,000 | 100% |
| Less: contractual adjustments | ($6,200,000) | (62%) |
| Less: charity care | ($380,000) | (3.8%) |
| Less: bad debt / price concessions | ($120,000) | (1.2%) |
| = Net patient service revenue | $3,300,000 | 33% |
In this example, a hospital billing $10 million collects $3.3 million. The other $6.7 million is adjustments — Medicare and Medicaid write-downs, commercial payer discounts, and write-offs for care provided without payment.
Under current GAAP (ASC 606), income statements present revenue at the net amount. Gross charges appear in the notes, not on the face of the statement. This is worth knowing when reading audited financials — the top line you see is already net of all adjustments. For a point-in-time view of what the practice owns and owes, the healthcare balance sheet shows how net AR and malpractice reserves complement these revenue figures.
The Full Revenue Structure
Beyond patient service revenue, most healthcare providers have additional income streams:
Capitation revenue. Under capitated managed care contracts, a provider receives a fixed per-member-per-month (PMPM) payment regardless of how much care members actually use. A contract paying $500 PMPM for 3,000 enrolled members generates $1.5 million per year, independent of service volume. This revenue is predictable and smooths the cash flow volatility that characterizes fee-for-service medicine.
Other operating revenue. This catchall category includes hospital cafeteria and parking revenue, rental income from physician office suites, research grants, medical education programs, and charitable contributions at nonprofit institutions.
A complete healthcare income statement top section:
| Line | Amount |
|---|---|
| Net patient service revenue | $3,300,000 |
| Capitation revenue | $480,000 |
| Other operating revenue | $120,000 |
| Total net operating revenue | $3,900,000 |
Expense Structure: Labor Dominates
Unlike most industries where input costs vary with production volume, healthcare expenses are heavily labor-driven and largely fixed in the short term. You can't staff a clinic with fewer nurses because the schedule is full.
According to AHA 2024 data on community hospitals, labor represents approximately 60% of total operating expenses. The breakdown:
| Expense Category | % of Total Expenses |
|---|---|
| Labor (wages, benefits, contract staff) | ~60% |
| Medical/surgical supplies | ~13% |
| Drugs and pharmacy | ~8% |
| Other operating expenses | ~19% |
For smaller medical practices, the labor percentage often runs higher — employed physician and clinical staff compensation can represent 60–70% of total expenses when physician pay is included.
Other line items that appear below revenue:
- Depreciation and amortization — significant for hospital systems with capital-intensive facilities, imaging equipment, and EHR systems
- Interest expense — hospitals carry substantial long-term debt for facility construction and renovation
- Professional liability (malpractice) insurance — a major cost that varies dramatically by specialty
- Administrative overhead — billing, coding, claims processing, and compliance carry high cost in healthcare; claims administration costs U.S. providers over $50 billion annually
- Facility costs — rent, utilities, and maintenance
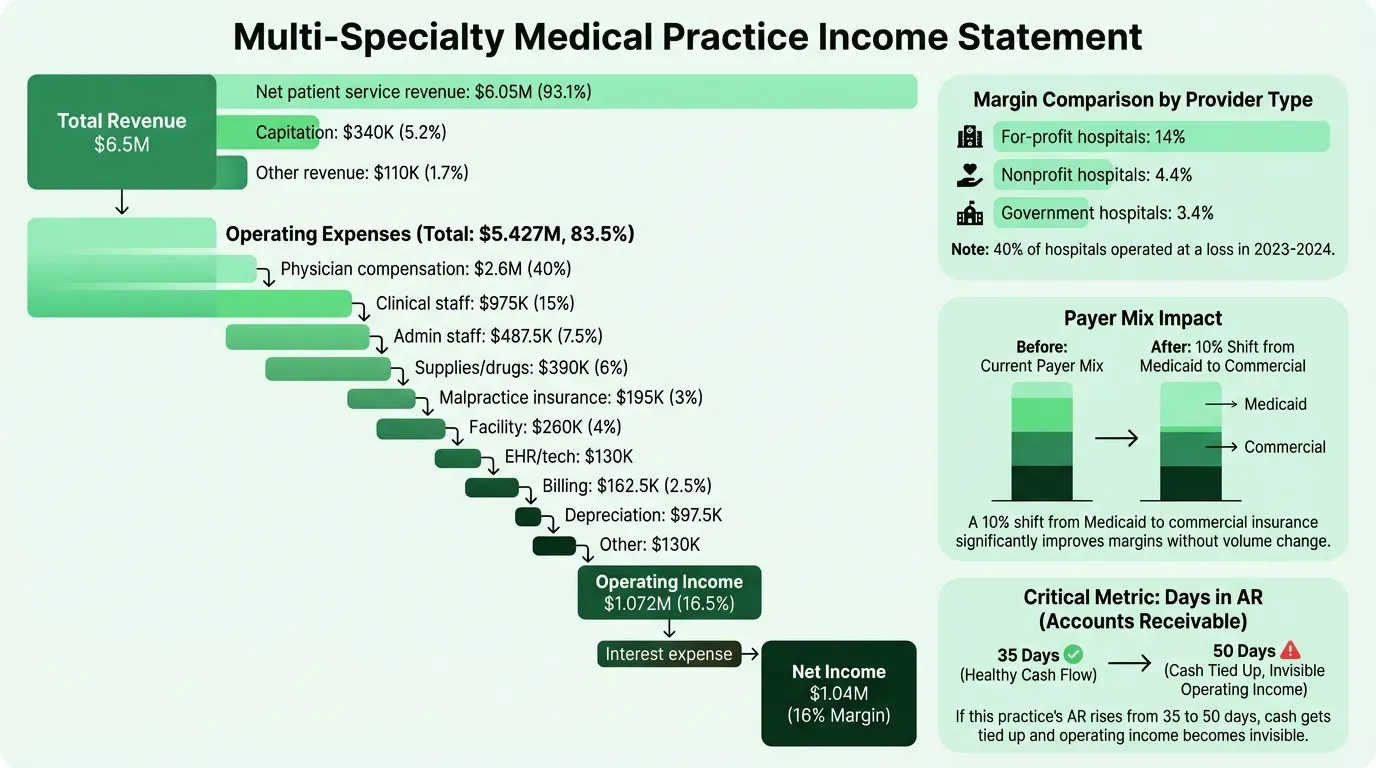
Worked Example: Multi-Specialty Medical Practice
Here's a realistic annual income statement for a multi-specialty outpatient practice with eight employed physicians generating approximately $6.5 million in net revenue:
Revenue
| Line | Amount | % of Revenue |
|---|---|---|
| Net patient service revenue | $6,050,000 | 93.1% |
| Capitation revenue | $340,000 | 5.2% |
| Other operating revenue | $110,000 | 1.7% |
| Total net operating revenue | $6,500,000 | 100% |
Operating Expenses
| Line | Amount | % of Revenue |
|---|---|---|
| Physician compensation and benefits | $2,600,000 | 40.0% |
| Clinical support staff (nurses, MAs, techs) | $975,000 | 15.0% |
| Administrative staff | $487,500 | 7.5% |
| Medical supplies and drugs | $390,000 | 6.0% |
| Professional liability insurance | $195,000 | 3.0% |
| Facility rent and utilities | $260,000 | 4.0% |
| EHR and technology | $130,000 | 2.0% |
| Billing and collections | $162,500 | 2.5% |
| Depreciation | $97,500 | 1.5% |
| Other administrative | $130,000 | 2.0% |
| Total operating expenses | $5,427,500 | 83.5% |
Operating income: $1,072,500 (16.5%)
Below Operating Income
| Line | Amount |
|---|---|
| Interest expense | ($32,500) |
| Net income | $1,040,000 (16.0%) |
This practice is performing well above the typical hospital operating margin. Outpatient practices can achieve higher margins than hospitals because they carry less capital overhead, have more control over payer mix (by selecting which insurance contracts to accept), and don't carry the fixed costs of 24/7 inpatient capacity.
Need a ready-made income statement template for your healthcare?
Download a pre-built spreadsheet with industry-specific categories, formulas, and formatting.
Operating Margin Benchmarks
Healthcare margins vary more than most industries because payer mix — the percentage of revenue from Medicare, Medicaid, commercial insurance, and self-pay — has a direct and significant impact on profitability.
According to KFF data on hospital operating margins:
| Provider Segment | Operating Margin (2023) |
|---|---|
| For-profit hospitals | 14.0% |
| All hospitals (median) | 5.2% |
| Nonprofit hospitals | 4.4% |
| Government hospitals | 3.4% |
| Rural hospitals | 3.1% |
| Non-micropolitan rural | 1.8% |
Approximately 40% of all hospitals operated at a loss in 2023 and 2024. System-affiliated hospitals (5.8%) consistently outperform independents (2.5%), reflecting the negotiating leverage and administrative efficiencies that come with scale.
For medical practices, the benchmarks differ. Well-run practices typically target EBITDA margins of 10–20%. Primary care practices tend toward the lower end; high-volume specialty practices (radiology, dermatology, ophthalmology) can exceed 20%. You can test your own practice's margins with the healthcare profit margin calculator.
EBITDA vs. EBIDA: The Healthcare Distinction
Healthcare finance uses EBITDA differently depending on provider type:
EBITDA (Earnings Before Interest, Taxes, Depreciation, and Amortization) applies to for-profit providers, private practices, and acquisition analysis. It normalizes for financing decisions and non-cash charges to compare operating performance across providers.
EBIDA (Earnings Before Interest, Depreciation, and Amortization — note: no taxes) applies specifically to nonprofit hospitals. Since nonprofits don't pay income taxes, including a tax adjustment produces a metric that doesn't reflect their actual cost structure. EBIDA is the conservative, nonprofit-appropriate equivalent.
Nonprofit hospital benchmarks:
- EBITDA margin: ~7.3%
- EBIDA margin: ~6.0%
Bond rating agencies, lenders, and board finance committees use these metrics to assess debt service capacity. A hospital with a 7.3% EBITDA margin generating $15 million in EBITDA on $200 million in revenue has roughly $15 million to cover debt service, capital reinvestment, and reserves — before any net income target.
Four Metrics Healthcare Finance Teams Watch
AR Days (Days in Accounts Receivable). Average days to collect payment after a service is delivered. Target range is 30–50 days for most providers. High AR days signal billing inefficiency, payer disputes, or prior authorization delays. Less than 10% of total AR should be more than 90 days old.
Payer mix. The percentage of revenue from each payer type. Commercial payers reimburse at rates 2–3x what Medicare pays for the same service, so a shift in payer mix — even without a volume change — directly impacts margins. A practice that converts 10% of its patient volume from Medicaid to commercial can see a significant operating income improvement without seeing any more patients.
Days cash on hand (DCOH). Total cash divided by average daily operating expenses. The benchmark for hospital creditworthiness is approximately 150 days. Below 30 days is a warning sign. Low DCOH is why hospitals that appear profitable on paper can face genuine liquidity crises — the income statement tells you about earnings, not cash timing.
Denial rate. The percentage of claims denied on first submission by payers. Industry average denial rates have risen above 10% in recent years. Each denied claim requires rework — or is written off entirely. Practices with clean claim rates above 95% collect meaningfully more revenue from the same patient volume than those at 88–90%. If you're projecting forward, a healthcare pro forma should build denial assumptions directly into the collections rate.
Common Mistakes on Healthcare Income Statements
Confusing gross charges with real revenue. Listing $10 million in "revenue" when gross charges are $10 million and net collections are $3.3 million produces a meaningless P&L. Always present revenue at the net patient service revenue line.
Misclassifying provider compensation. In physician-owned practices, owner/physician draws are often structured as distributions rather than salary. If physician compensation isn't treated consistently year over year — or if it's not included in operating expenses — operating margins become incomparable. Standardize physician compensation treatment before benchmarking.
Ignoring the payer mix shift. A practice that looks like it's growing revenue 8% year over year may have simply shifted toward a better commercial payer mix. Without payer mix analysis alongside the income statement, the driver of the improvement is invisible.
Underestimating billing costs. Billing, coding, and claims processing consume 5–8% of net revenue for most practices. Providers who outsource billing frequently undercount this as a percentage of net revenue, making in-house billing look more expensive than outsourced alternatives by comparison.
Reading the Income Statement in Context
A healthcare income statement is most useful when read alongside two other documents:
The balance sheet provides the cash position and accounts receivable balance. A provider posting a 5% operating margin but carrying 60 days of AR has a cash flow profile that looks very different from one with 35 days of AR.
The cash flow statement separates operating cash generation from capital investment and debt service. Hospitals often report positive net income while consuming cash through facility projects, equipment replacement, and principal payments on long-term debt. To understand the timing gap between earnings and cash, the healthcare cash flow calculator models collection cycles against expense obligations.
For practices managing these statements in Excel, the Healthcare Income Statement Template includes the net patient revenue structure, payer mix breakdowns, and expense categories pre-configured for outpatient medical practices. If you're also tracking profitability against a forward plan, the Financial Planning templates include structures across multiple healthcare provider types.
Last updated: March 24, 2026
Frequently Asked Questions
Related Articles
Coffee Shop Income Statement Example: Revenue, Costs, and Margins
A coffee shop income statement example with beverage cost benchmarks, labor targets, prime cost rules, and a worked P&L for an independent café doing $480K/year.
Daycare Income Statement Example: Revenue, Costs, and Margins
A daycare income statement example with tuition revenue, CACFP reimbursements, staff cost benchmarks, and a worked P&L for a 50-child childcare center.
Food Truck Income Statement Example: Line Items and Benchmarks
A food truck income statement example with food cost benchmarks, unique line items like commissary and pitch fees, and a worked P&L for a single-truck operation.
Healthcare Pro Forma Example: What to Include and How to Build One
A practical healthcare pro forma example — covering revenue projections, payer mix, expense benchmarks, and a worked model for a new medical practice or service line.
Hotel Pro Forma Example: What to Include and How to Build One
A practical hotel pro forma example — covering RevPAR, GOP, undistributed expenses, FF&E reserves, and a worked model for acquisition or development underwriting.
Manufacturing Income Statement Example: Line Items and Benchmarks
A manufacturing income statement example with COGM schedule, gross margin benchmarks by subsector, and a worked P&L for a precision parts manufacturer.