Healthcare Income Statement Template
A healthcare income statement template built for medical practices — with revenue by payer type, net collection rate tracking, and operating expense categories that match how a clinic actually runs.
What's Inside This Healthcare Income Statement Template
This template includes 4 worksheets, each designed for a specific part of your healthcare financial workflow:
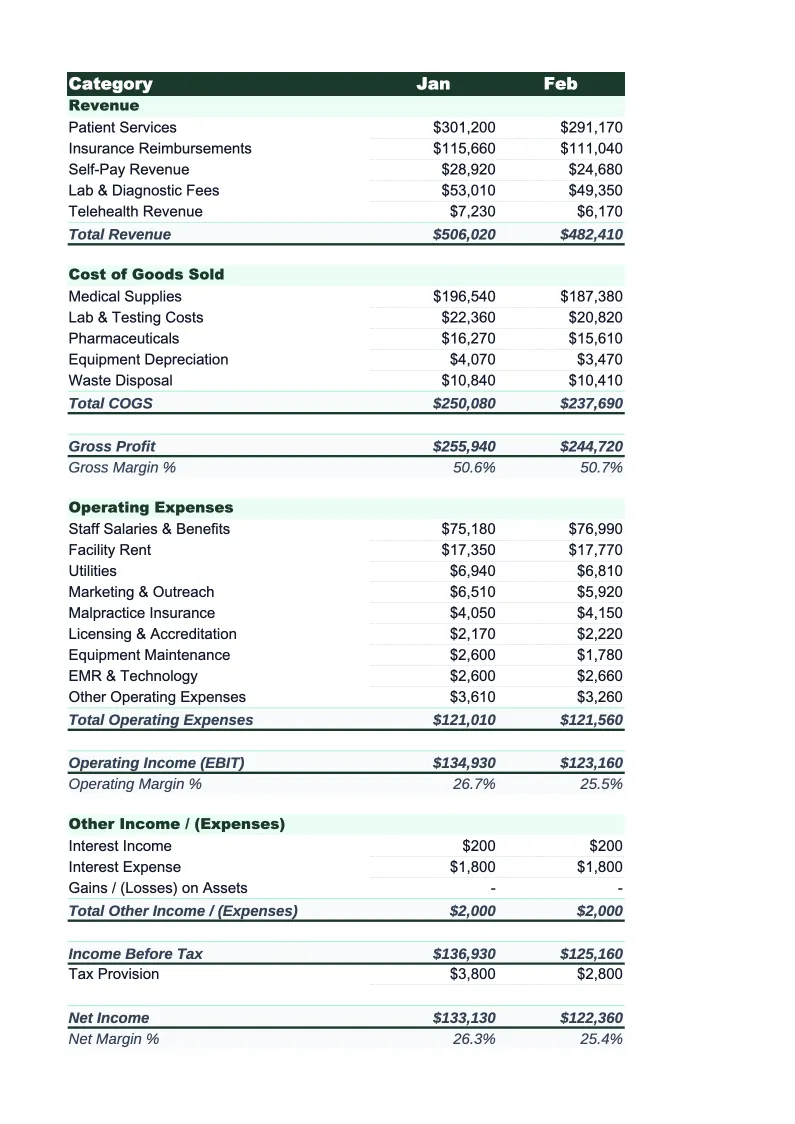
Monthly Income Statement
The core P&L worksheet structured around how healthcare practices bill and collect revenue.
Annual Summary
A 12-month consolidated view that aggregates each monthly income statement into a single worksheet.
Payer Mix Analysis
A dedicated worksheet for analyzing revenue by insurance payer.
Key Metrics
A metrics dashboard tracking the financial KPIs that determine whether a healthcare practice is operating efficiently.
Healthcare Income Statement Template Features
- Revenue tracked by payer type: Medicare, Medicaid, commercial insurance, and self-pay
- Gross charges vs. net collections with contractual adjustment calculation
- Net collection rate and AR days calculated automatically
- Clinical staff and admin/billing staff compensation tracked separately
- Payer mix analysis showing each payer's share of total net revenue
- Key metrics dashboard with industry benchmark ranges built in
How to Use This Healthcare Income Statement Spreadsheet
Start by opening the Monthly Income Statement sheet and setting up your payer structure. Replace the default payer categories with the specific insurers you work with, or keep the broad groupings (Medicare, Medicaid, commercial, self-pay) if that level of detail is sufficient. Enter your billing codes' typical fee schedule amounts or your average charge per visit to populate the gross charges column. This one-time setup takes 15–20 minutes and gives you a structure you can use month after month without rebuilding.
Each month, pull your practice management or billing system report and enter gross charges, contractual adjustments, and net collections by payer. Then enter operating expenses from your bank statements or accounting software. Start with compensation — physician and clinical staff, then administrative and billing staff — before moving to fixed costs like rent, malpractice insurance, and EMR fees. The income statement, payer mix analysis, and key metrics sheets all update automatically. Most practices can complete a full monthly entry in under 30 minutes once the structure is set up.
15 minutes from download to your first income statement
Download the template, enter your collections by payer and your operating expenses, and see your practice's actual margins — net collection rate, operating margin, and revenue per provider all calculated automatically.
Why Every Medical Practice Needs a Proper Income Statement
Healthcare practices face a financial reporting problem that most other businesses don't: the gap between what you charge and what you collect. A primary care practice might bill $250,000 in gross charges in a month and collect $140,000 — and whether that 56% collection rate is acceptable or a sign of serious billing problems depends entirely on your payer mix and your contractual rates. Generic income statements built around revenue recognized when earned don't capture this complexity. A healthcare-specific income statement separates gross charges, contractual adjustments, and net collected revenue so you can see what's actually flowing through your practice.
The cost structure of a medical practice is also different from other service businesses. Clinical staff — physicians, mid-levels, nurses, and medical assistants — represent the largest and most variable cost, but they're also your revenue-generating capacity. Administrative and billing staff are overhead but directly affect how much of what you bill you actually collect. Malpractice insurance is a fixed cost but varies dramatically by specialty. EMR and practice management software costs have grown significantly over the past decade. A properly structured healthcare income statement groups these costs in a way that lets you see where money is going and which costs are necessary versus which are dragging down your operating margin.
Healthcare Industry at a Glance
Financial templates built for healthcare practices — from private clinics and therapy offices to specialty practices and medical groups. Pre-loaded with billing categories, insurance reimbursement tracking, and healthcare-specific KPIs.
Revenue Drivers
- Insurance reimbursements
- Patient copays and coinsurance
- Out-of-pocket self-pay
- Capitation payments
Key Cost Categories
- Clinical staff salaries
- Administrative and billing staff
- Medical supplies
- Malpractice insurance
- EMR/EHR software
- Facility rent and occupancy
Typical Margins
Gross: 45-65% · Net: 10-25%
Seasonality
Higher patient volume in fall/winter flu season; slower in summer. End-of-year spike as patients meet deductibles.
Key Performance Indicators
Healthcare Income Statement Template FAQ
More Healthcare Templates
Healthcare Balance Sheet Template for Excel
$29
Healthcare Budget Template for Excel
$29
Healthcare Business Plan Template for Excel
$39
Healthcare Cash Flow Template for Excel
$29
Healthcare Expense Tracker Template for Excel
$29
Healthcare Financial Model Template for Excel
$29
Healthcare Invoice Template for Excel
$29
Healthcare KPI Dashboard Template for Excel
$29
Healthcare P&L Template for Excel
$29
Healthcare Pro Forma Template for Excel
$29
Healthcare Project Budget Template for Excel
$29
Healthcare Sales Forecast Template for Excel
$29
Healthcare Practice Valuation Template for Excel
$29
More Income Statement Templates
Accounting Firm Income Statement Template for Excel
$29
Auto Repair Income Statement Template for Excel
$29
Car Wash Income Statement Template for Excel
$29
Church Income Statement Template for Excel
$29
Cleaning Service Income Statement Template for Excel
$29
Coffee Shop Income Statement Template for Excel
$29
Healthcare Income Statement Template
$29