Law Firm Budget Example: Real Numbers for Small Firms
A practical law firm budget example covering revenue projections, overhead benchmarks, staffing ratios, and the Rule of Thirds framework for small firm profitability.
Most attorneys start their firms without any formal business training. That gap shows up in the budget — or the absence of one.
A well-built law firm budget does two things: it forces realistic revenue forecasting based on billable hour capacity, and it brings overhead into a ratio you can actually sustain. The benchmarks here apply to solo practitioners and small firms with two to ten attorneys.
The Revenue Side: Where Most Firm Budgets Go Wrong
The most common budgeting mistake in law firms is forecasting revenue at face value — multiplying billable hours by billing rates without accounting for the two discounts that erode every law firm's top line.
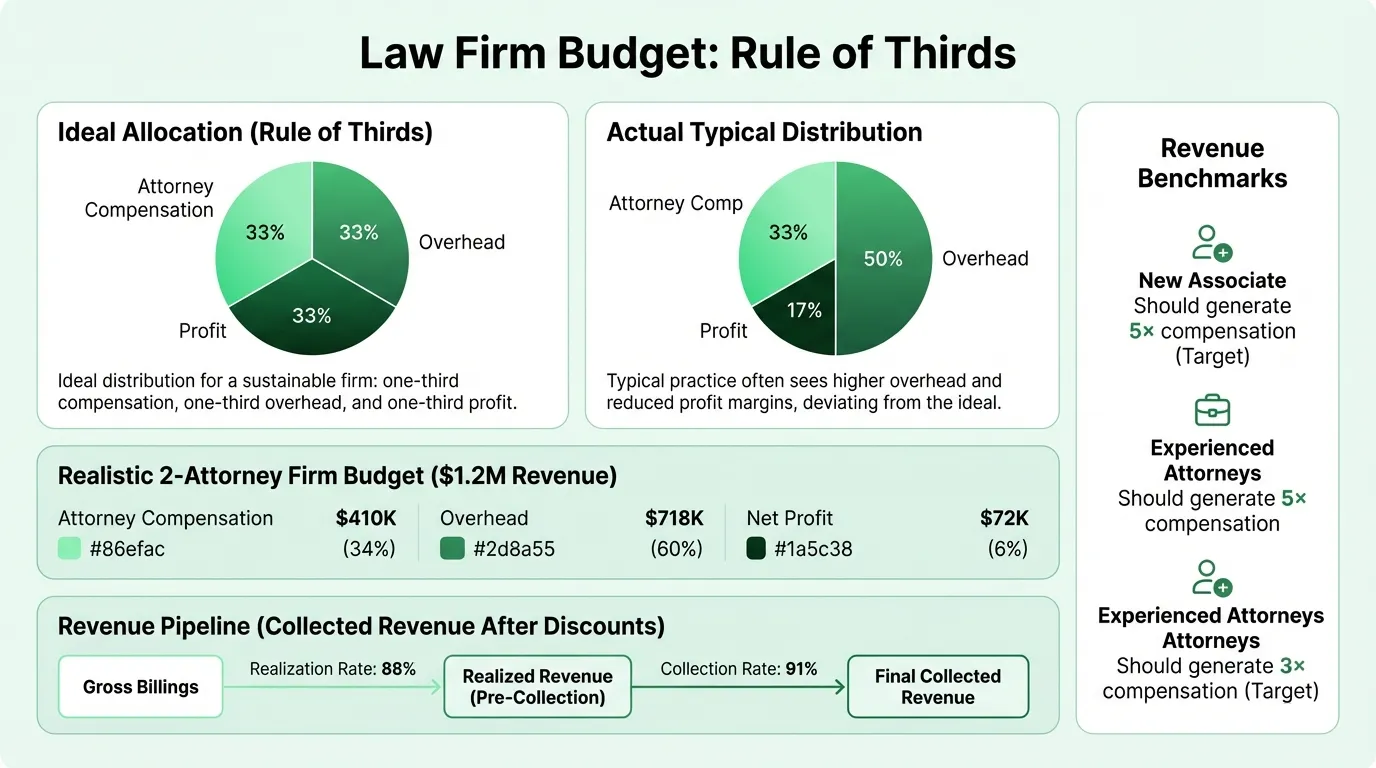
Realization rate is the percentage of billed time that clients actually pay. The average across law firms is 88%. A firm billing $800,000 at standard rates collects, on average, $704,000.
Collection rate is the percentage of invoiced amounts that firms actually receive (after billing, not before). The industry average is 91%. Applied together, an attorney billing $800,000 at standard rates collects roughly $640,000.
The utilization picture is even more striking. According to the Clio 2024 Legal Trends Report, the average attorney logs only 37% of their day as billable time — about 2.9 billable hours out of an 8-hour workday. Solo practitioners average just 26%. Administrative work, business development, and firm management consume the rest.
When building your budget, project billable hours conservatively. If an attorney works 200 days and targets 5 billable hours per day, that's 1,000 billable hours. At $300/hour, gross billings are $300,000. Apply an 88% realization rate and 91% collection rate, and collected revenue is roughly $240,000 — not $300,000. For a deeper look at how these efficiency metrics drive profitability, see our law firm accounting guide.
The Rule of Thirds
The Rule of Thirds is the simplest framework for assessing whether a law firm's financial structure is healthy. It divides revenue into three equal parts:
- 1/3 (33%) → Attorney and billable staff compensation
- 1/3 (33%) → Overhead expenses
- 1/3 (33%) → Profit and partner distributions
In practice, most firms spend 45–50% of revenue on overhead — not 33%. That gap comes out of the profit third. A firm with 50% overhead and 33% attorney compensation is left with 17% for profit, well below the 30–45% target for small firms.
The Rule of Thirds isn't a rigid formula — practice areas, markets, and firm structures vary — but it's a reliable diagnostic. If your overhead is above 50% of collected revenue, something is misaligned: rent, staffing ratios, or underpriced services.
Law Firm Expense Benchmarks
Here's how law firm expenses break down as a percentage of revenue, based on benchmarks across small and mid-size firms:
| Expense Category | Benchmark Range |
|---|---|
| Attorney compensation | 25–35% |
| Non-attorney staff | 10–20% |
| Rent and occupancy | 4–7% |
| Technology and software | 3–6% |
| Marketing and business development | 2–10% |
| Malpractice insurance | 2–4% |
| Professional services (accounting, HR) | 2–5% |
| Office, supplies, utilities | 2–4% |
| Bar dues and CLE | 1–2% |
| Total overhead | 45–55% |
A few of these deserve more attention:
Rent. IRS data for solo law firm proprietorships shows rent averaging 4% of revenue. The recommended ceiling is 7%. If you're above that, you're running a real estate expense that constrains every other budget line.
Technology. Practice management software, legal research platforms (Westlaw, Lexis), document management, and cybersecurity typically run 8–12% of total overhead. Notably, 36% of law firms have no formal technology budget — these costs often get absorbed as miscellaneous expenses without being tracked properly. Track all overhead categories alongside your assets and liabilities using the law firm balance sheet.
Marketing. The only firm-wide benchmark that varies widely by practice area. Personal injury firms regularly spend 20–25% of revenue on advertising. Estate planning and transactional firms often operate with 2–4%. Know which market you're competing in before setting this figure.
Example Budget: Small Litigation Firm
Here's a realistic annual budget for a two-attorney litigation firm with one paralegal, targeting $1.2M in collected revenue:
Revenue
| Source | Collected Amount | % of Revenue |
|---|---|---|
| Senior attorney billings (900 hrs × $350/hr, 88% real., 91% coll.) | $711,000 | 59% |
| Associate attorney billings (800 hrs × $225/hr, 85% real., 90% coll.) | $138,000 | 12% |
| Paralegal billings (600 hrs × $120/hr, 90% real., 91% coll.) | $59,000 | 5% |
| Flat fee matters and retainers | $292,000 | 24% |
| Total Collected Revenue | $1,200,000 |
Overhead
| Category | Annual Amount | % of Revenue |
|---|---|---|
| Senior attorney compensation + benefits | $280,000 | 23.3% |
| Associate attorney compensation + benefits | $130,000 | 10.8% |
| Paralegal salary + benefits | $75,000 | 6.3% |
| Rent (2,000 sq ft at $3,500/mo) | $42,000 | 3.5% |
| Technology (practice mgmt, legal research, IT) | $24,000 | 2.0% |
| Malpractice insurance | $30,000 | 2.5% |
| Marketing (SEO, directory listings, referral events) | $36,000 | 3.0% |
| Accounting and HR consulting | $18,000 | 1.5% |
| Office supplies, utilities, phone | $15,000 | 1.3% |
| Bar dues, CLE, professional development | $9,000 | 0.8% |
| Court filing fees, expert witnesses, case costs | $24,000 | 2.0% |
| Contingency buffer (5%) | $34,150 | 2.8% |
| Total Overhead | $717,150 | 59.8% |
Net Pre-Tax Profit: $482,850 (40.2% of revenue)
This firm runs lean: office rent is well under 7% of revenue, technology is budgeted formally, and marketing is at the low end for a litigation practice relying on referral networks. The profit margin of 40% sits within the target range for a small firm. Apply the Law Firm Budget Template to run these calculations against your own billing rates and cost structure.
Need a ready-made budget template for your law firm?
Download a pre-built spreadsheet with industry-specific categories, formulas, and formatting.
Attorney Revenue Benchmarks
A useful internal benchmark: each attorney should generate revenue that's a multiple of their total compensation cost.
| Seniority Level | Target Revenue Multiple |
|---|---|
| New associates | 5× total compensation |
| Mid-level associates | 4× total compensation |
| Senior attorneys/partners | 3× total compensation |
If a new associate costs $85,000 in total compensation (salary plus benefits), they should generate $425,000 in collected revenue. If they're only collecting $250,000, either the billing rate, utilization, or realization rate is too low — or all three.
The better firm-wide benchmark is revenue per attorney. Healthy small firms land at $400,000–$500,000 in collected revenue per attorney. Strong firms are at $500,000–$600,000. Above $600,000 signals either high billing rates, excellent utilization, or both. Check where your firm stands with the law firm profit margin calculator.
Practice Area Budgeting Differences
The budget structure above works for hourly billing litigation. Practice areas with different fee structures need adjustments:
Contingency fee practices (personal injury, workers' comp): Revenue is lumpy — nothing until a case settles, then a large inflow. The budget needs a cash reserve of 6+ months of expenses, and marketing spend is typically 20–25% of revenue rather than 2–5%. Revenue projections should be based on historical settlement averages and case volume, not billable hour targets.
Flat fee practices (estate planning, immigration, criminal defense): Revenue is more predictable by matter type but depends heavily on volume. The budget focuses on matter throughput — how many estates, visa petitions, or criminal matters can the firm handle per month — and expenses per matter rather than hourly billing math.
Transactional practices (real estate, corporate, M&A): Revenue often correlates with market activity. Real estate attorneys see strong seasonal patterns tied to home sales volume; M&A practices track deal flow. Budgets for these practices need seasonality adjustments and a cash reserve that covers slow quarters. Model your firm's cash timing with the law firm cash flow calculator.
Building a Budget That Actually Gets Used
A budget created in January and checked in December provides no value. Law firm budgets work when they're reviewed monthly and updated quarterly.
The monthly review has three steps:
- Compare actual collected revenue to budget by attorney and practice area
- Review actual expenses by category against the monthly budget allocation
- Identify any overhead categories running above benchmark percentages
The quarterly update adjusts projections based on pipeline — cases expected to resolve, retainers likely to renew, marketing investments coming online. Attorney departures, new hires, and lease renewals also trigger budget revisions.
For firms without a formal review process, the Law Firm Budget Template includes a monthly comparison layout alongside the annual view, so tracking actuals against budget stays in one document. If you also want to track profitability by practice area or attorney, that connects directly to financial planning templates built for professional services.
One Number to Watch
If you're going to track a single metric, track overhead as a percentage of collected revenue. Keep it below 50%. When overhead creeps above that level, it forces a choice: raise rates, increase volume, or cut expenses. All three require decisions that are much easier to make when you see the trend building — not after it's already compressed your distributions.
Attorneys are trained to analyze risk on behalf of clients. Apply the same rigor to your own firm's finances, and most of the surprises that derail small practices become manageable.
Last updated: March 23, 2026
Frequently Asked Questions
Related Articles
Coffee Shop Budget Example: Real Numbers and Benchmarks
A practical coffee shop budget example with real cost benchmarks — covering beverage COGS, labor, rent, equipment maintenance, and the line items most operators underestimate.
Church Budget Example: Categories, Percentages, and What to Include
A practical church budget example with real percentages for staff, facilities, missions, and programs — plus the line items most churches overlook.
Construction Budget Example: Line Items, Percentages, and What to Include
A practical construction budget example covering hard costs, soft costs, overhead allocation, and the line items most contractors underestimate.
Daycare Budget Example: Categories, Benchmarks, and What to Watch
A practical daycare budget example covering revenue sources, expense ratios, occupancy thresholds, and the line items that determine whether a center stays financially viable.
Event Planning Budget Example: Real Numbers for Your Business
A practical event planning budget example covering agency overhead, per-event costs, revenue models, and the benchmarks every planner needs to protect margins.
Hotel Budget Example: Departments, Benchmarks, and Real Numbers
A practical hotel budget example covering the USALI department structure, labor benchmarks, GOP targets, and the line items independent hoteliers most often miss.