Manufacturing Budget Example: Line Items and Benchmarks
A practical manufacturing budget example covering direct materials, labor, overhead benchmarks, and the gross margin ranges that vary widely by subsector.
Manufacturing budgets live and die on cost structure. Unlike service businesses where labor dominates, manufacturers manage three distinct cost buckets — materials, direct labor, and overhead — each with different drivers, different timing, and different levers for protecting margins.
Get the structure right, and the budget tells you exactly how costs behave when production volume changes. Get it wrong, and you're planning with averages that don't reflect how the business actually works.
The Three-Layer Cost Structure
Every manufacturing budget separates costs into three layers:
Direct materials — raw materials and components consumed in production. This is the largest cost line for most manufacturers. IRS data from small manufacturing businesses shows materials averaging 42% of revenue. For commodity-intensive subsectors (food processing, basic chemicals, auto parts), it can run 60–75% of revenue.
Direct labor — wages for production floor workers directly involved in making the product. IRS data puts all-in labor (direct production plus supervisory) at roughly 15% of revenue for small manufacturers. That's lower than most people expect — automation and capital-intensive production have compressed direct labor as a share of total costs.
Manufacturing overhead — everything else required to run the plant: facility rent or mortgage, equipment depreciation, production utilities, maintenance, quality control, materials handling, and indirect labor (supervisors, maintenance techs, warehouse staff). Variable overhead moves with production volume; fixed overhead stays flat regardless of output.
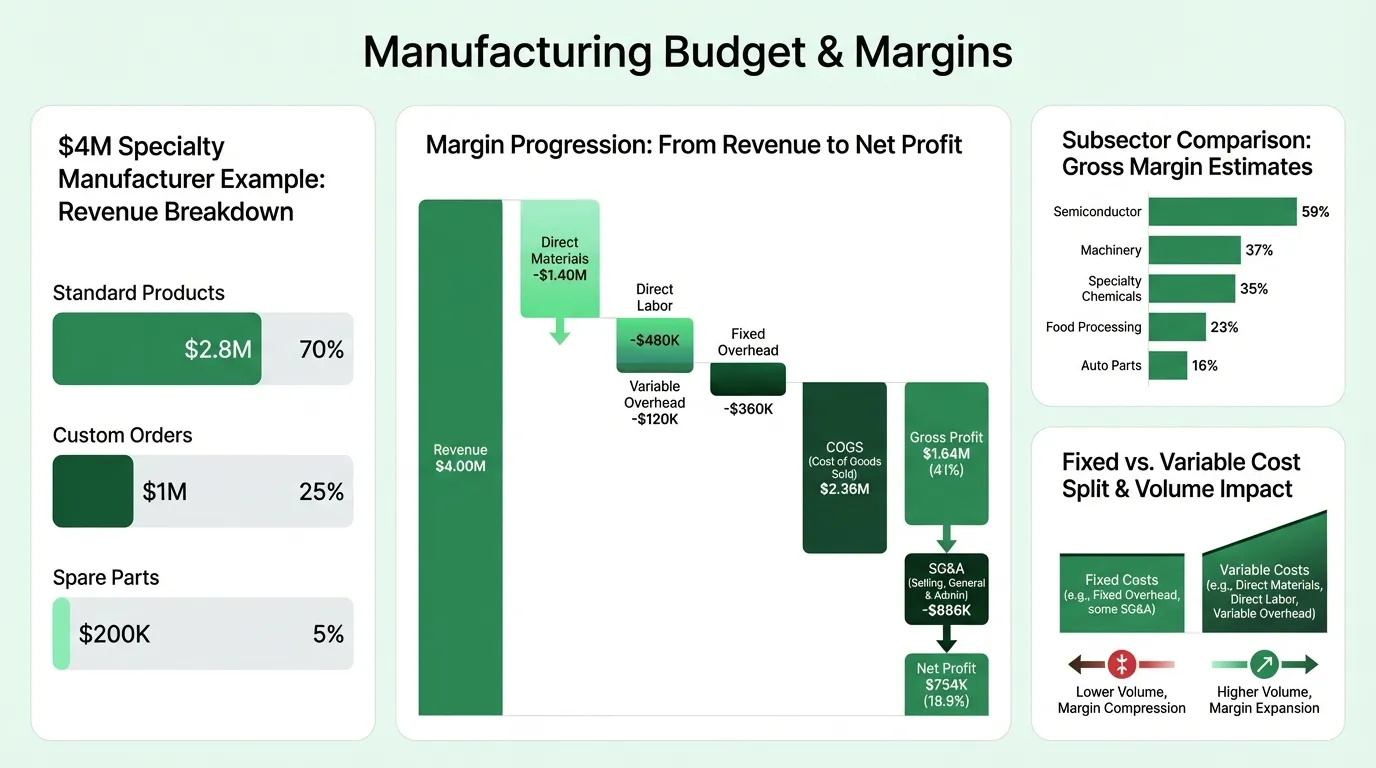
The fixed vs. variable split matters for budgeting because it determines how margins behave when revenue changes. According to industry data, variable costs typically represent 50–70% of total manufacturing costs, with fixed costs at 30–50%. A manufacturer with a high fixed cost share sees margins expand quickly as volume grows — and compress sharply when volume drops. Budget at an optimistic volume assumption and you risk systematic overhead underabsorption when production comes in below plan. Our manufacturing break-even calculator helps you find the production volume where fixed costs are fully absorbed.
Gross Margin Benchmarks by Subsector
Gross margin in manufacturing varies more than almost any other industry. The right target depends entirely on what you make.
| Manufacturing Subsector | Typical Gross Margin |
|---|---|
| Semiconductor | ~59% |
| Beverage (soft drinks) | ~55% |
| Machinery and equipment | ~37% |
| Chemical (specialty) | ~35% |
| Food processing | ~23% |
| Auto parts | ~16% |
| Auto and truck | ~10% |
Source: NYU Stern School of Business, Damodaran data (January 2026, publicly traded U.S. companies)
Every line in your budget — SG&A, interest, taxes, profit — has to fit within the gross margin. A food processor at 23% gross margin has 23 cents on every dollar to cover overhead, management, compliance, financing, and profit. A specialty machinery maker at 37% gross margin has more than half again as much room.
Before finalizing your revenue plan, verify that your gross margin target is achievable given your material costs, labor rates, and overhead base. Cross-check against your subsector benchmark. If your gross margin is running 5–8 points below industry average, the culprit is usually materials (supplier pricing or yield loss) or overhead absorption (production volume below budget). Our manufacturing accounting guide covers the overhead allocation methods that determine how those costs attach to your products.
SG&A and Operating Expenses
Manufacturing companies run lower SG&A relative to revenue than service businesses or retailers because most costs sit in COGS rather than below the gross profit line. Typical SG&A for manufacturers runs 10–25% of revenue, with the range reflecting differences in sales model (direct vs. distribution), product complexity, and R&D intensity.
| SG&A Category | Typical Range (% of Revenue) |
|---|---|
| Sales and marketing (commissions, trade shows, reps) | 3–8% |
| General and administrative (executive, finance, HR, IT) | 4–10% |
| Research and development (for product-type manufacturers) | 2–8% |
| Professional services (legal, accounting) | 1–3% |
| Contingency | 1–2% |
A few categories manufacturers routinely underbudget:
Trade shows and customer acquisition. B2B manufacturers often drive significant revenue through industry trade shows, distributor relationships, and customer visits. These costs are real and event-driven — budget them by event calendar, not as a flat annual percentage.
Compliance and certifications. ISO certifications, safety audits, environmental compliance, and industry-specific regulatory requirements (FDA for food manufacturers, UL for electronics) are predictable annual costs. They shouldn't appear as budget surprises.
ERP and manufacturing software. As manufacturers scale, system costs grow. Track ERP licensing, MES (manufacturing execution system), and related IT separately from general IT — and include both annual maintenance and any implementation or upgrade spending.
Need a ready-made budget template for your manufacturing?
Download a pre-built spreadsheet with industry-specific categories, formulas, and formatting.
Example Budget: $4M Specialty Manufacturer
Here's a realistic annual budget for a specialty machinery manufacturer with 15 employees:
Revenue
| Category | Amount | % of Revenue |
|---|---|---|
| Standard catalog products | $2,800,000 | 70% |
| Custom and engineered orders | $1,000,000 | 25% |
| Spare parts and consumables | $200,000 | 5% |
| Total Revenue | $4,000,000 |
Cost of Goods Sold
| Category | Amount | % of Revenue |
|---|---|---|
| Direct materials | $1,400,000 | 35% |
| Direct labor (wages and payroll taxes) | $480,000 | 12% |
| Variable overhead (production utilities, supplies) | $120,000 | 3% |
| Fixed overhead (rent, depreciation, maintenance, indirect labor) | $360,000 | 9% |
| Total COGS | $2,360,000 | 59% |
| Gross Profit | $1,640,000 | 41% |
SG&A and Operating Expenses
| Category | Amount | % of Revenue |
|---|---|---|
| Sales team (salary and commissions) | $240,000 | 6% |
| Marketing (trade shows, catalog, digital) | $120,000 | 3% |
| Executive and management compensation | $200,000 | 5% |
| Finance and accounting | $60,000 | 1.5% |
| IT and ERP systems | $40,000 | 1% |
| Professional services (legal, audit) | $30,000 | 0.75% |
| Insurance (general liability, product liability) | $36,000 | 0.9% |
| R&D and product development | $80,000 | 2% |
| Contingency (2%) | $80,000 | 2% |
| Total SG&A | $886,000 | 22.2% |
| Net Pre-Tax Profit | $754,000 | 18.9% |
This example produces a strong net margin (18.9%) driven by a 41% gross margin — which is achievable for specialty machinery but not for commodity manufacturing. A food processor or auto parts supplier operating at 15–23% gross margin would need dramatically lower SG&A to reach the same profit outcome, or would accept a much thinner margin.
Apply your own numbers using the Manufacturing Budget Template, which has this cost structure laid out by month with the gross margin and SG&A categories already built in.
Capital Expenditure and the Budget
Manufacturing is capital-intensive. Equipment, tooling, facility improvements, and infrastructure are ongoing costs that don't appear in the operating budget — they're capitalized on the balance sheet and flow through the P&L as depreciation.
A manufacturing budget that excludes CapEx is incomplete. The CapEx plan should cover:
- Equipment purchases — new machines, replacement of aging assets, capacity additions
- Tooling and molds — particularly relevant for injection molding, stamping, and precision manufacturing
- Facility improvements — layout changes, electrical upgrades, environmental compliance
- Maintenance capital — planned spending to sustain existing asset performance, distinct from the operating maintenance expense already in overhead
One useful check: if annual depreciation is $200,000 (5% of $4M in revenue), you need to be investing at least that amount in new capital each year to maintain your production asset base. CapEx consistently below depreciation means you're running down capacity — a fact that won't show up in the manufacturing income statement until equipment failures or capacity constraints force the issue.
Capacity and Volume Planning
The financial budget connects to the production plan through two variables that most manufacturing budgets ignore until it's too late:
Capacity utilization: According to Federal Reserve data, U.S. manufacturers ran at approximately 75.6% capacity utilization as of late 2024, versus a long-run average of around 79.5%. A budget projecting 90%+ utilization without capital additions is either optimistic or forecasting a bottleneck. Know your current capacity ceiling before building revenue assumptions.
Inventory planning: Manufacturing budgets must project beginning and ending inventory for raw materials, work-in-process, and finished goods. A plan to grow production volume 20% requires more raw material purchases before the revenue arrives. This working capital buildup is real cash outflow in the quarter before the revenue quarter — budget it explicitly rather than treating it as a reconciling item. Our manufacturing inventory management guide covers how to set reorder points and safety stock levels that align with these production volume assumptions.
Common Manufacturing Budgeting Mistakes
Budgeting at a single volume assumption. Manufacturing margins are sensitive to volume because of fixed overhead. Budget at three scenarios: base case, downside (80% of base), and upside (120% of base). The downside scenario tells you whether fixed costs are sustainable if revenue comes in short.
Averaging across product lines. A manufacturer selling both low-margin standard products and high-margin engineered or custom products can't budget at a blended margin. When the mix shifts, profits change — and an averaged budget won't tell you why.
Missing scrap and rework costs. Material waste, defective output, and rework are real production costs that should be budgeted explicitly. World-class manufacturers target scrap rates under 1%; if you're running 3–5%, that belongs on its own budget line, not absorbed into materials as an unexplained variance.
Underestimating the cash gap on inventory builds. A production ramp-up requires material purchases ahead of the revenue. Budget the cash outflow when it actually occurs — before the finished goods sell — not when the revenue arrives.
Skipping the monthly budget-vs-actual review. A manufacturing budget reviewed at year-end is decoration. Monthly comparison of actual COGS by category — materials, labor, overhead — tells you whether variances are volume-driven (less production, overhead spreads over fewer units) or efficiency-driven (higher cost per unit). That distinction determines what you do about it.
The Manufacturing Budget Template structures the monthly comparison alongside the annual plan so the review stays in one document. If you also need to track profitability across multiple cost centers or product lines, the budget templates section includes formats for other industries that follow the same monthly structure.
Last updated: March 23, 2026
Frequently Asked Questions
Related Articles
Coffee Shop Budget Example: Real Numbers and Benchmarks
A practical coffee shop budget example with real cost benchmarks — covering beverage COGS, labor, rent, equipment maintenance, and the line items most operators underestimate.
Church Budget Example: Categories, Percentages, and What to Include
A practical church budget example with real percentages for staff, facilities, missions, and programs — plus the line items most churches overlook.
Construction Budget Example: Line Items, Percentages, and What to Include
A practical construction budget example covering hard costs, soft costs, overhead allocation, and the line items most contractors underestimate.
Daycare Budget Example: Categories, Benchmarks, and What to Watch
A practical daycare budget example covering revenue sources, expense ratios, occupancy thresholds, and the line items that determine whether a center stays financially viable.
Event Planning Budget Example: Real Numbers for Your Business
A practical event planning budget example covering agency overhead, per-event costs, revenue models, and the benchmarks every planner needs to protect margins.
Hotel Budget Example: Departments, Benchmarks, and Real Numbers
A practical hotel budget example covering the USALI department structure, labor benchmarks, GOP targets, and the line items independent hoteliers most often miss.