Manufacturing Accounting: A Practical Guide for Operators
How manufacturing accounting works — covering cost of goods manufactured, overhead allocation, inventory methods, and the financial reports that matter most.
Manufacturing accounting isn't more complicated than other business accounting — it's differently structured. The difference is that manufacturers transform inputs into outputs, and every step of that transformation has a cost that needs to be tracked, allocated, and reported correctly.
Get that structure right and your financial reports accurately reflect what it costs to make what you sell. Get it wrong and your product costs are wrong, your pricing is wrong, and the margin problems you see on the P&L are difficult to trace to their source.
Why Manufacturing Accounting Is Different
Retail and service businesses have relatively simple cost structures. A retailer buys inventory and sells it. The cost is what they paid. A service firm sells labor and overhead — no inventory transformation required.
Manufacturing breaks this simplicity in two ways.
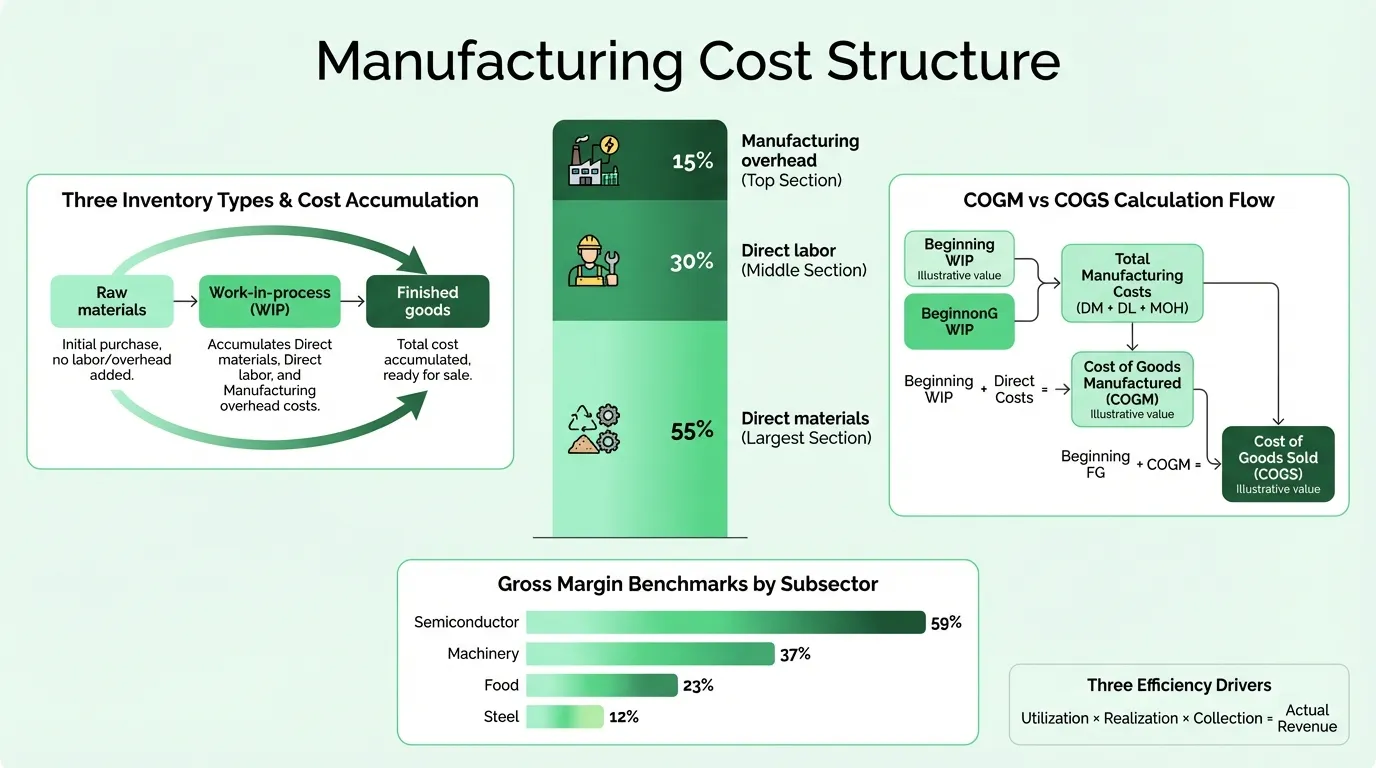
Three inventory categories instead of one. Manufacturers carry raw materials (inputs not yet in production), work-in-process (WIP — items currently being made), and finished goods (completed products awaiting sale). All three appear on the manufacturing balance sheet. All three move and change value as production progresses.
COGS flows through a two-step calculation. A retailer's COGS is the purchase price of what was sold. A manufacturer's COGS flows through cost of goods manufactured (COGM) first — a calculation that captures all three cost components and both inventory adjustments before anything hits the income statement.
These two differences ripple through every financial statement a manufacturer produces.
The Three Manufacturing Cost Components
Every product a manufacturer makes carries three types of cost:
Direct materials — Raw inputs that become part of the finished product and are directly traceable to it. Steel in an automotive part. Lumber in furniture. Flour in a food product. Direct materials are the most straightforward cost category: you know what went into each unit and what it cost.
Direct labor — Wages of workers who physically transform direct materials into finished goods. Machine operators, assembly line workers, fabricators. Not supervisors, not quality control staff, not maintenance crews — those belong in overhead. Direct labor accounts for roughly 20% of manufacturing revenue on average, though this varies considerably by industry and automation level.
Manufacturing overhead — Every other production cost that doesn't fit the first two categories: factory rent and utilities, equipment depreciation, machinery maintenance, production supervision, quality control, factory supplies. Overhead is real — it can represent 30–50% of total product cost — but it can't be traced to individual units the way direct materials can. That's what makes overhead allocation the central challenge of manufacturing accounting.
Two useful combinations:
- Prime cost = Direct materials + Direct labor (the costs directly traceable to products)
- Conversion cost = Direct labor + Overhead (the costs of converting raw materials into finished goods)
Cost of Goods Manufactured vs. Cost of Goods Sold
These two calculations are distinct but connected, and confusing them is one of the most common manufacturing accounting errors.
Cost of Goods Manufactured (COGM):
Beginning WIP Inventory + Direct Materials Used + Direct Labor + Manufacturing Overhead − Ending WIP Inventory = COGM
COGM represents the total cost of goods completed and transferred to finished goods inventory during the period — regardless of whether they were sold. It's a balance sheet movement: costs shift from WIP to finished goods.
Cost of Goods Sold (COGS):
Beginning Finished Goods Inventory + COGM − Ending Finished Goods Inventory = COGS
COGS is the income statement event: costs shift from finished goods inventory to expense when products are actually sold.
The practical implication: if you produce 10,000 units but sell only 8,000, only 8,000 units' worth of cost hits COGS. The remaining 2,000 units sit in finished goods inventory on the balance sheet. This matters for both tax reporting and for understanding the relationship between production volume and reported profitability.
The Manufacturing Income Statement Template is structured with COGM and COGS as separate line items, which makes this flow visible in your monthly reporting.
Job Costing vs. Process Costing
These are the two primary methods for accumulating manufacturing costs, and the right choice depends on what you make.
Job costing accumulates costs per production job. Each order gets its own cost record: materials requisitioned, labor hours logged, overhead applied. Used when products are distinct and customized — custom fabrication, contract manufacturing, aerospace components, specialty orders. Job costing requires more record-keeping but gives you precise cost data per order. When a job comes in over budget, you know exactly which cost category drove the overrun.
Process costing accumulates costs by department or production stage, then averages them across all units produced in the period. Used for mass production of identical units — food processing, chemicals, petroleum refining, plastics. When 50,000 identical units come off a line, tracking individual unit costs isn't practical or useful. Process costing gives you an average cost per unit that you can compare against price and margin targets.
Some manufacturers use a hybrid: process costing for standard production runs and job costing for custom orders or high-value contracts.
Overhead Allocation: Getting It Right
Overhead allocation is where manufacturing accounting diverges most sharply from other accounting. You need to get overhead into product costs — but unlike direct materials and direct labor, you can't observe how much overhead went into each unit. You have to apply it using a predetermined rate.
The standard approach:
- Estimate total overhead for the period (budget)
- Choose a cost driver — the measurable activity that best correlates with overhead consumption
- Calculate a predetermined overhead rate = Estimated overhead ÷ Estimated cost driver volume
- Apply overhead to each product based on actual cost driver usage
Common cost drivers and when to use them:
| Driver | Best for |
|---|---|
| Direct labor hours | Labor-intensive production with limited automation |
| Machine hours | Capital-intensive or automated operations |
| Direct labor cost | When labor rates vary across product lines |
| Units of production | Single-product or near-identical product lines |
The limitation of single-driver methods: if you make products with very different production profiles, one driver will systematically overallocate overhead to some products and underallocate to others. A complex part that requires frequent machine setups and quality inspections carries more overhead than a simple part of the same weight — direct labor hours won't capture that difference.
Activity-Based Costing (ABC) addresses this by identifying multiple cost drivers — machine setups, quality inspections, material handling moves, engineering support hours — and tracing each overhead cost pool to products based on actual activity consumption. ABC provides more accurate product costs in multi-product environments but requires substantially more data collection. It's most commonly implemented by larger manufacturers with diverse product lines where pricing accuracy is critical.
Need a ready-made p&l template for your manufacturing?
Download a pre-built spreadsheet with industry-specific categories, formulas, and formatting.
Inventory Valuation Methods
How you value inventory affects both your balance sheet and your COGS — and therefore your gross margin. Three methods are common in manufacturing:
FIFO (First-In, First-Out) assumes the oldest inventory is used first. During periods of rising material costs, FIFO produces higher inventory values on the balance sheet and higher reported profits (because lower-cost old inventory hits COGS before higher-cost newer inventory). Approximately 53% of S&P 500 companies used FIFO as of 2021.
LIFO (Last-In, First-Out) assumes the newest inventory is used first. During inflation, this reduces taxable income because higher-cost recent purchases hit COGS first. LIFO is permitted only under US GAAP — it's banned under IFRS — and its use has been declining, with more companies switching away from it even during recent inflationary periods. Only around 16% of S&P 500 companies used LIFO as of 2021.
Weighted Average Cost averages all units together, smoothing out price fluctuations. Most practical when materials are pooled or mixed and individual unit tracking isn't possible — bulk chemicals, grain processing, commodity inputs where batches are commingled. It produces results between FIFO and LIFO in terms of income and inventory effects.
The choice matters more during periods of significant input cost changes. When material prices are stable, the three methods produce similar results. For a deeper look at how inventory valuation decisions affect day-to-day operations, see our manufacturing inventory management guide.
What Gross Margins Look Like by Subsector
Manufacturing gross margins vary enormously by subsector — a benchmark that works for a specialty chemical company will be misleading for a steel producer. From ReadyRatios data on U.S. publicly traded companies:
| Subsector | Gross Margin |
|---|---|
| Semiconductor | 59% |
| Measuring/Analytical Instruments | 53% |
| Industrial Machinery | 37% |
| Rubber & Plastics | 35% |
| Electronic & Electrical Equipment | 32% |
| Paper & Allied Products | 17% |
| Primary Metals | 17% |
| Steel | 12% |
The broad manufacturing average sits between 25–35%, but subsector matters more than the average. A machinery manufacturer running 30% gross margin is performing reasonably. A semiconductor company at 30% is well below what its cost structure should allow.
Track your gross margin against subsector benchmarks, not aggregate manufacturing averages. Our manufacturing profit margin calculator lets you compare your numbers against these ranges quickly.
The Financial Statements That Matter
Three statements are essential for manufacturing operations, and each answers a different question:
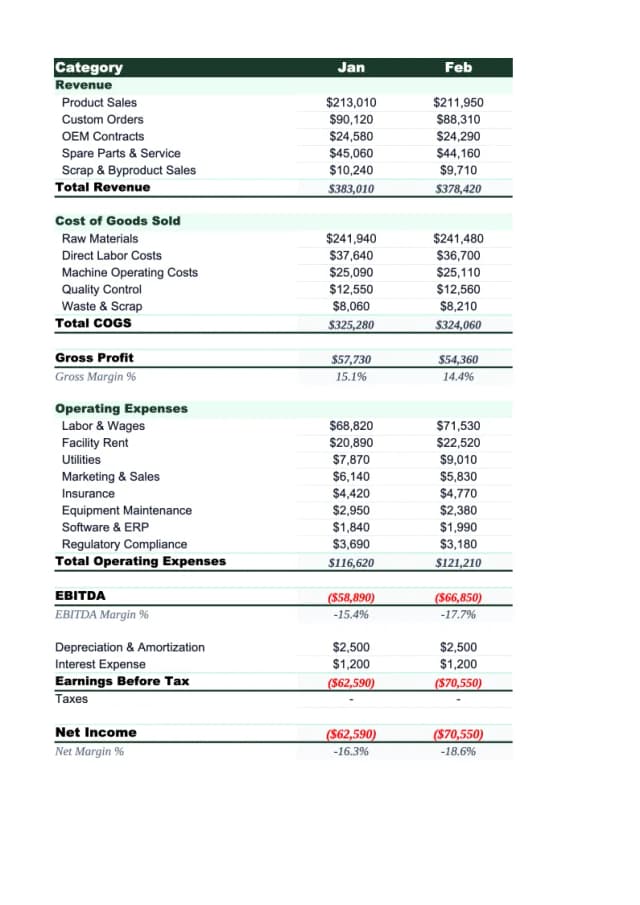
Income Statement (P&L): Are we making money? The manufacturing P&L should break out COGM separately from COGS, and should show gross margin clearly. If your P&L doesn't distinguish subscription or contract revenue from product revenue, you can't tell which lines are profitable. The Manufacturing P&L Template is structured with manufacturing-specific cost lines.
Balance Sheet: What do we own and owe? For manufacturers, this includes the three inventory categories (raw materials, WIP, finished goods) as separate line items. Lumping them together hides production efficiency signals — a growing WIP balance relative to finished goods can indicate a throughput bottleneck. The Manufacturing Balance Sheet Template separates all three.
Cash Flow Statement: When does money actually move? The cash flow statement is where manufacturing timing mismatches become visible. You buy raw materials and pay labor weeks before products ship and invoices are collected. During growth periods, manufacturers can be profitable but cash-constrained — more inventory, more receivables, more capital tied up. The operating activities section of the cash flow statement shows how working capital changes are affecting actual cash. The Manufacturing Cash Flow Template tracks these movements.
Common Manufacturing Accounting Mistakes
Misallocating overhead. The most prevalent error is applying overhead using a cost driver that doesn't reflect actual overhead consumption. In an automated facility, using direct labor hours as the overhead driver can produce wildly inaccurate product costs — products with long machine cycle times but minimal labor appear artificially cheap. Review your cost driver annually.
Capitalizing the wrong overhead costs. GAAP requires manufacturing overhead to be capitalized into inventory based on normal capacity utilization — not actual output. If production drops due to low demand, you can't spread the same total overhead across fewer units and pretend that's the normal product cost. Idle capacity costs should be expensed, not capitalized into inventory values.
Misclassifying CapEx vs. OpEx. Equipment upgrades, major repairs, and tooling replacements are sometimes expensed when they should be capitalized (or vice versa). This distorts depreciation schedules, asset values, and reported expenses in ways that compound over time.
Missing R&D tax credits. Manufacturers frequently fail to claim Research and Development tax credits for qualifying production activities — process improvements, materials testing, product development — because they don't document the activities in a way that supports a credit claim. This is money left on the table.
Weak inventory controls. Late data entry, manual counting errors, and unrecorded movements corrupt the inventory records that feed COGM and COGS. Inaccurate inventory data produces inaccurate financial statements in both directions — overstated inventory understates COGS and overstates profits; understated inventory does the opposite. Building a manufacturing budget with explicit scrap and rework lines prevents these variances from hiding in aggregate cost numbers.
Mixing administrative and production costs. Sales salaries, executive compensation, and administrative overhead belong in operating expenses — not manufacturing overhead. Misclassifying them inflates product costs and produces gross margins that understate actual production efficiency.
Building a Manufacturing Accounting System That Works
The foundation is a chart of accounts designed for manufacturing — one that separates direct materials, direct labor, and overhead subcategories, that tracks the three inventory types independently, and that flows COGM through to COGS correctly.
On top of that, you need a costing method that fits your production model (job or process), an overhead allocation approach that reflects how your facility actually consumes overhead, and an inventory valuation method that matches your material flow and tax situation.
Most manufacturing operators don't need specialized ERP software to get this right, especially at smaller scales. The right spreadsheet structure — with cost tracking built in, inventory movements reconciled monthly, and COGM calculated explicitly — handles the accounting requirements that matter for tax reporting, lender presentations, and operational decisions.
The Manufacturing Financial Model Template covers cost projections, scenario planning, and the financial outputs that matter when you're evaluating production changes or presenting to lenders.
The accounting infrastructure isn't glamorous. But the operators who build it correctly have financial statements that actually tell them what's happening in their business — and the ones who don't spend months trying to figure out why margins are lower than they expected. When it's time to present those financials to lenders or partners, Deckary turns your reports into consulting-grade slides.
Last updated: March 24, 2026
Frequently Asked Questions
Related Articles
Church Accounting Best Practices: A Practical Guide
How church accounting works — fund accounting, restricted funds, internal controls, financial reports, and the tax rules that catch churches off guard.
Church Balance Sheet Example: A Line-by-Line Breakdown
A complete church balance sheet example with real line items, fund accounting explained, and the benchmarks church boards use to assess financial health.
Construction Accounting: A Practical Guide for Contractors
Construction accounting is different from standard accounting. This guide covers job costing, WIP schedules, retainage, revenue recognition methods, and common mistakes.
Construction Balance Sheet Example: A Line-by-Line Breakdown
A complete construction company balance sheet example with real line items, WIP accounting, retainage, overbilling, and what sureties and lenders look for.
Daycare Balance Sheet Example: Line by Line
A complete daycare balance sheet example with real line items — enrollment deposits, playground equipment, subsidy receivables, and what the numbers mean.
Food Truck Balance Sheet Example: A Line-by-Line Breakdown
A complete food truck balance sheet example with real line items, truck depreciation rules, and what makes a food truck's financials different from a restaurant.