Manufacturing Budget Template
Budget your manufacturing business with a template built around direct materials, direct labor, and overhead — the three cost layers that drive every factory's bottom line.
What's Inside This Manufacturing Budget Template
This template includes 5 worksheets, each designed for a specific part of your manufacturing financial workflow:
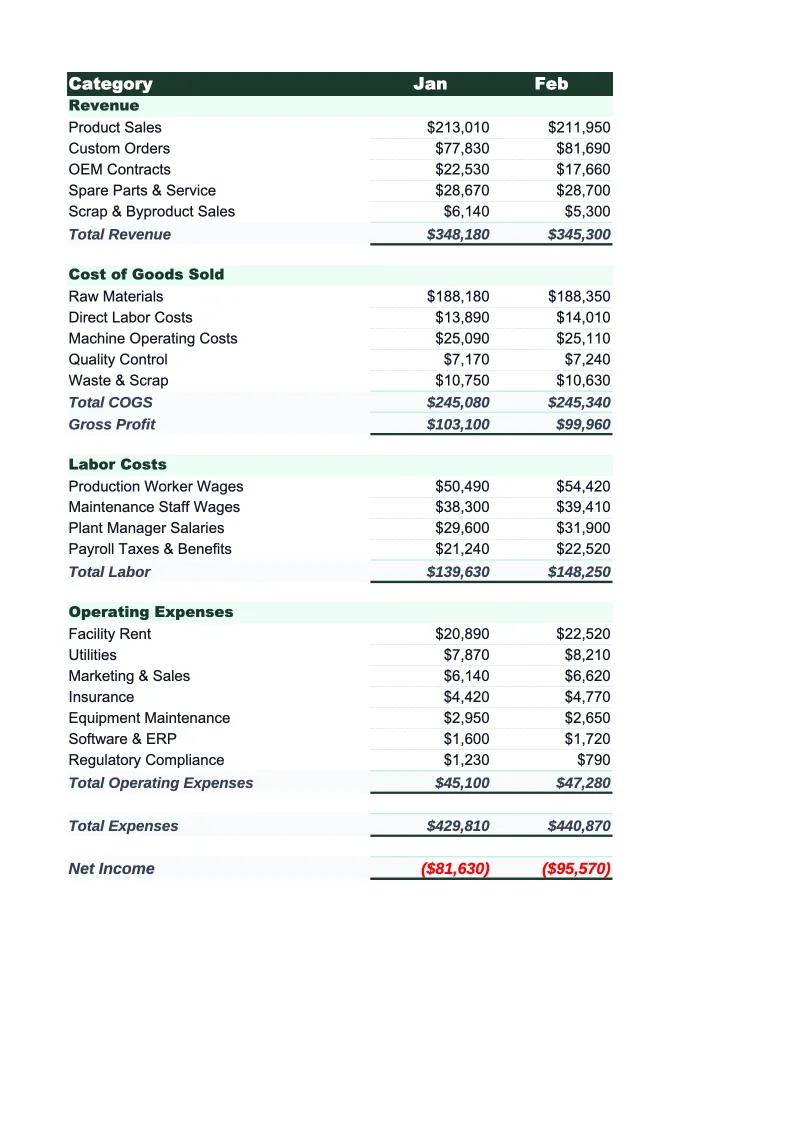
Monthly Budget
The main planning worksheet where you project each month's revenue and costs using the three-layer structure standard in manufacturing accounting.
Production Cost Sheet
A per-unit or per-job costing worksheet that tracks standard cost versus budgeted cost for each product line or production order.
Annual Summary
A 12-month rollup that pulls from each monthly sheet automatically.
Budget vs Actual
Track planned figures against what actually happened for every cost category — direct materials, direct labor, variable overhead, fixed overhead, SG&A, and total revenue.
Dashboard
A visual summary page with pre-built charts showing gross margin percentage by month, overhead rate trend, revenue vs.
Manufacturing Budget Template Features
- Direct materials, direct labor, and manufacturing overhead cost structure
- Monthly budget with 12-month annual rollup
- Budget vs actual variance tracking with color-coded alerts
- Per-unit or per-job production cost sheet with standard cost calculation
- Overhead allocation rate auto-calculation
- Visual dashboard with gross margin %, overhead rate, and revenue trends
How to Use This Manufacturing Budget Spreadsheet
Getting started takes about 15 minutes. Download the .xlsx file and open it in Excel or Google Sheets — no macros or plugins required. Start with the Monthly Budget sheet: review the pre-loaded cost categories and adjust them to match your operation. Most manufacturers keep the three-layer COGS structure (direct materials, direct labor, manufacturing overhead) as-is and customize the specific line items within each layer. If you run a job shop, you may want to rename the product-line revenue rows to match your service types.
Once the categories are set up, enter your revenue projections and planned costs for the current month. If you're starting mid-year, use your last three months of actual spending as a baseline for the remaining months — it doesn't need to be perfect on day one. Fill in the Production Cost Sheet with your standard costs per unit or per job to get a sense of whether your pricing covers materials, labor, and overhead at your target margin. Copy the monthly structure forward for the remaining months, adjusting for seasonal demand shifts or planned production volume changes.
15 minutes from download to your first manufacturing budget
Download the template, plug in your numbers, and see your factory's full cost picture — materials, labor, overhead, and variance tracking all in one spreadsheet.
Why Every Manufacturer Needs a Budget Template
Manufacturing budgets are structurally different from most small business budgets because costs operate in layers. Direct materials and direct labor move with production volume — when you make more units, these costs go up. Manufacturing overhead (facility rent, equipment depreciation, maintenance, supervisor salaries) is mostly fixed and must be recovered across whatever volume you actually produce. When production volume drops below plan, overhead cost per unit rises and margins compress — even if you haven't spent a dollar more than budgeted. Understanding this dynamic is the core reason manufacturers need structured budgets rather than simple income trackers.
A proper manufacturing budget separates these three cost layers explicitly. Direct materials should be budgeted by category — raw materials (metals, plastics, components, etc.), purchased sub-components, packaging, and a scrap allowance based on your historical yield rate. Direct labor should reflect actual hours at standard rates, split from your indirect labor (maintenance techs, material handlers, QA staff) which belongs in overhead. Fixed manufacturing overhead — facility rent, equipment depreciation, property taxes — needs to be budgeted separately from variable overhead like utilities, tooling replacement, and machine supplies, because they behave differently when volume changes. Most manufacturing businesses operating at 20–35% gross margins and 4–10% net margins don't have room for sloppy overhead tracking.
Manufacturing Industry at a Glance
Financial templates built for manufacturers — from job shops and contract fabricators to production facilities. Pre-loaded with cost categories, billing structures, and KPIs specific to how manufacturers track materials, labor, and overhead.
Revenue Drivers
- Product sales
- Contract/job shop work
- Tooling and setup fees
- NRE charges
- Material markups
- Aftermarket parts and service
Key Cost Categories
- Raw materials / direct materials
- Direct labor
- Manufacturing overhead
- Outside processing / subcontracting
- Equipment depreciation
- SG&A
Typical Margins
Gross: 20-35% · Net: 4-10%
Seasonality
Q1 weakest across most segments. Q3/Q4 strongest for consumer goods and construction materials manufacturers. Automotive suppliers follow OEM model-year shutdowns. Industrial equipment sees Q4 budget-spend surge.
Key Performance Indicators
Manufacturing Budget Template FAQ
More Manufacturing Templates
Manufacturing Balance Sheet Template for Excel
$29
Manufacturing Business Plan Template for Excel
$39
Manufacturing Cash Flow Template for Excel
$29
Manufacturing Expense Tracker Template for Excel
$29
Manufacturing Financial Model Template for Excel
$29
Manufacturing Income Statement Template for Excel
$29
Manufacturing Invoice Template for Excel
$29
Manufacturing KPI Dashboard Template for Excel
$29
Manufacturing P&L Template for Excel
$29
Manufacturing Pro Forma Template for Excel
$29
Manufacturing Project Budget Template for Excel
$29
Manufacturing Sales Forecast Template for Excel
$29
Manufacturing Business Valuation Template for Excel
$29
Manufacturing Budget Template
$29