Dental Practice Business Plan Template
Build a realistic dental practice business plan with patient capacity model, procedure revenue mix, and a 3-year financial projection accounting for staff efficiency and insurance reimbursement rates.
What's Inside This Dental Practice Business Plan Template
This template includes 5 worksheets, each designed for a specific part of your dental practice financial workflow:
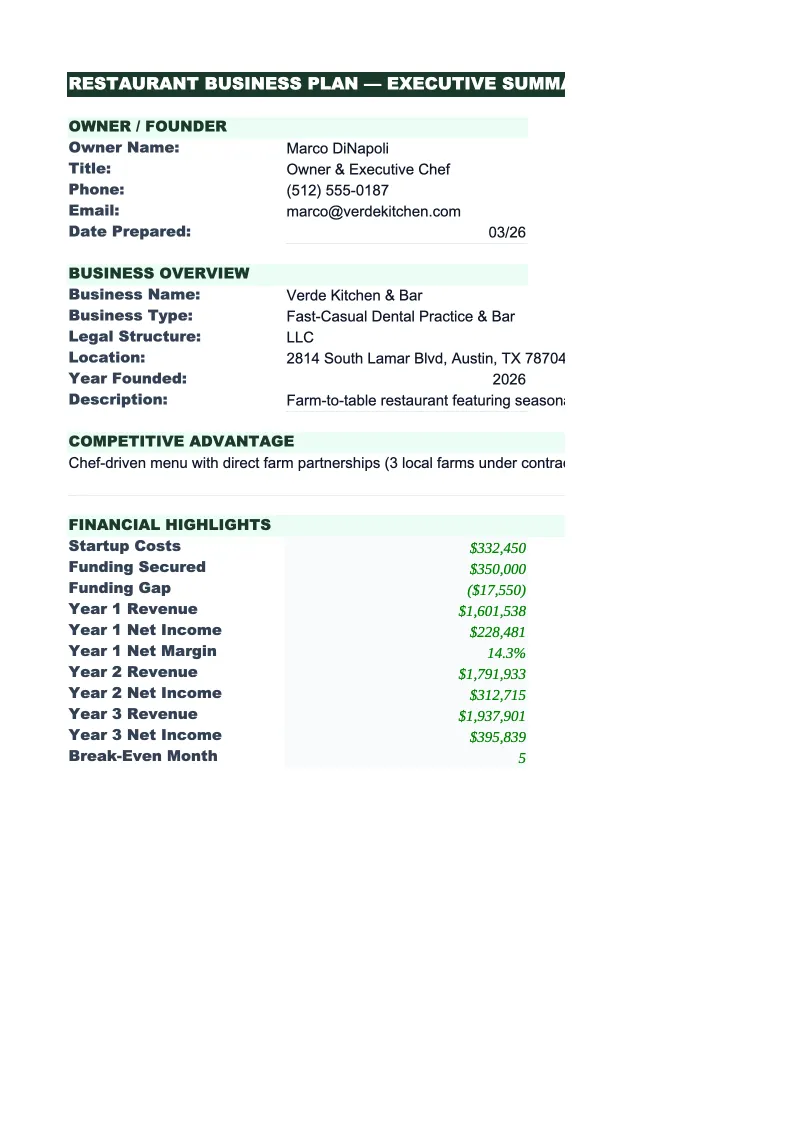
Executive Summary
A strategic overview of your dental practice, including practice concept (general dentistry, pediatric, specialty), target patient population (families, cosmetic patients, high-income demographics), and competitive positioning (location, insurance accepted, patient experience, technology).
Startup Costs & Funding
Details all capital required to open a dental practice, typically $200,000–$500,000.
Revenue Forecast
A 12-month detailed revenue projection for year one, then annual summaries for years two and three.
Projected P&L
Annual profit and loss statement showing gross revenue by procedure type, adjustments for insurance write-offs and patient discounts (insurance companies often reimburse 50–80% of your fee schedule), net revenue, cost of goods sold (dental materials—amalgam, composites, cements, typically 8–12% of gross revenue), hygienist and assistant labor (typically 25–35% of revenue), dentist compensation (often modeled as owner draw after expenses), occupancy (rent, utilities, insurance, maintenance, typically 12–18% of revenue), and operating expenses (supplies, marketing, software, continuing education, license maintenance, malpractice insurance).
Dashboard
A visual management tool showing: total startup investment and funding required, monthly and annual revenue by year, patient visit count and no-show %, average revenue per patient visit, break-even patient visit count (daily visits needed to cover fixed costs), materials COGS % of revenue, labor cost % of revenue, occupancy cost % of revenue, net profit margin %, and 36-month cumulative cash flow.
Dental Practice Business Plan Template Features
- Patient capacity model with procedure type and revenue by treatment category
- Insurance reimbursement tracking with write-off adjustments for contracted rates
- No-show rate modeling (typical 5–10% for dental practices) affecting patient volume
- Dental hygienist and assistant labor costs tracked separately from dentist compensation
- Startup costs for operatories, sterilization, imaging, and equipment
- Break-even analysis showing required daily patient visits and average procedure value
How to Use This Dental Practice Business Plan Spreadsheet
Start by defining your practice concept and gathering equipment quotes for the Startup Costs sheet. A single-operatory practice (one dental chair) requires roughly $200,000–$350,000; a two-operatory practice $300,000–$500,000+. Major line items: dental chairs and units ($15,000–$30,000 each), X-ray/imaging ($8,000–$25,000), office buildout to meet health department requirements ($30,000–$100,000), and working capital to sustain the practice during the patient-building phase ($30,000–$60,000). Get firm quotes from equipment vendors and buildout contractors before finalizing your capital requirement. Include licensing fees ($500–$3,000), malpractice insurance ($3,000–$8,000/year depending on coverage), and initial marketing budget ($3,000–$8,000).
Move to the Revenue Forecast sheet and model your patient acquisition timeline. Most new dental practices start at 30–50% of target patient volume in months one and two (limited by word-of-mouth, referrals, and new patient appointment availability) and ramp to 70–85% by months four through six. By month nine to twelve, established practices reach 85–95% of target capacity. Input your fee schedule by procedure type: preventive care (exams $100–$150, cleanings $100–$150), restorative (fillings $150–$300, crowns $900–$1,500), endodontics (root canal $800–$1,500). Factor in your insurance mix—if 60% of patients are private insurance, 30% HMO, 10% cash, your average reimbursement is typically 70–80% of your fee schedule due to contracted rates with insurance companies. Build in a 5–10% no-show rate (common for dental practices) which reduces available patient slots.
From practice concept to lender-ready projections in a few hours
Enter your operatory count, patient volume, fee schedule, and insurance mix—the model builds your 3-year financial outlook, break-even patient count, and startup capital requirement automatically.
Why Dentists Need a Detailed Business Plan
Dental practice economics are driven by patient volume, average procedure value, and insurance reimbursement rates. A dentist operating one operatory can see 6–12 patients per day (depending on mix of quick cleanings vs. complex restorations); two operatories can scale to 12–24 patients per day with good hygiene and support staff. Your fee schedule determines revenue per patient, but insurance contracts typically reimburse only 50–80% of your stated fees. If your fee schedule says a cleaning is $120 but your insurance contract pays 70%, you receive $84. Tracking gross revenue (what you charge), write-offs (what insurance doesn't reimburse), and net revenue (what you actually receive) is critical for cash flow planning.
The second key metric is clinical productivity—how efficiently you and your team turn patient time into revenue. A dentist who sees 8 patients per day with an average revenue of $200 per visit is producing $1,600/day in gross revenue. If that same dentist improves efficiency to 10 patients per day or increases average revenue to $250 per visit (through more restorative work, less preventive), revenue scales to $2,000–$2,500 per day. Hygienists are often more productive—a full-time hygienist producing $2,000–$3,000 per day in preventive services (exams, cleanings, fluoride) is common. Most dental practices use a producer-based compensation model: the dentist and hygienists are compensated based on what they produce, with the practice taking 30–50% as overhead recovery.
Dental Practice Industry at a Glance
Financial templates built for dental practices — from solo general dentists to multi-provider offices. Pre-loaded with CDT billing categories, insurance adjustment tracking, and the KPIs that matter to practice owners.
Revenue Drivers
- Patient exam and hygiene visits
- Restorative procedures (fillings, crowns, root canals)
- Implants and prosthetics
- Specialty services (whitening, Invisalign)
- Insurance reimbursements and fee-for-service collections
Key Cost Categories
- Staff salaries and benefits
- Dental supplies (chairside materials)
- Lab fees (outsourced crown and denture fabrication)
- Rent and facility
- Equipment and depreciation
- Marketing and patient acquisition
- Practice management software and billing systems
- Professional services (accounting, legal)
Typical Margins
Gross: 75-80% · Net: 30-40%
Seasonality
Summer peak driven by children's appointments before school year; year-end surge as patients use expiring insurance benefits; January restorative surge as annual maximums reset.
Key Performance Indicators
Dental Practice Business Plan Template FAQ
More Dental Practice Templates
Dental Practice Balance Sheet Template for Excel
$29
Dental Practice Budget Template for Excel
$29
Dental Practice Cash Flow Template for Excel
$29
Dental Practice Expense Tracker Template for Excel
$29
Dental Practice Financial Model Template for Excel
$29
Dental Practice Income Statement Template for Excel
$29
Dental Practice Invoice Template for Excel
$29
Dental Practice KPI Dashboard Template for Excel
$29
Dental Practice P&L Template for Excel
$29
Dental Practice Pro Forma Template for Excel
$29
Dental Practice Project Budget Template for Excel
$29
Dental Practice Sales Forecast Template for Excel
$29
Dental Practice Valuation Template for Excel
$29
More Business Plan Templates
Dental Practice Business Plan Template
$39