Dental Practice Cash Flow Template
Track and project cash flow for your dental practice — with insurance reimbursement timing, patient balance collections, lab fee cycles, bi-weekly payroll, and a 13-week projection built around the cash gaps that practice owners actually face.
What's Inside This Dental Practice Cash Flow Template
This template includes 4 worksheets, each designed for a specific part of your dental practice financial workflow:
13-Week Cash Flow
A rolling 13-week cash projection covering the most actionable planning window for a dental practice.
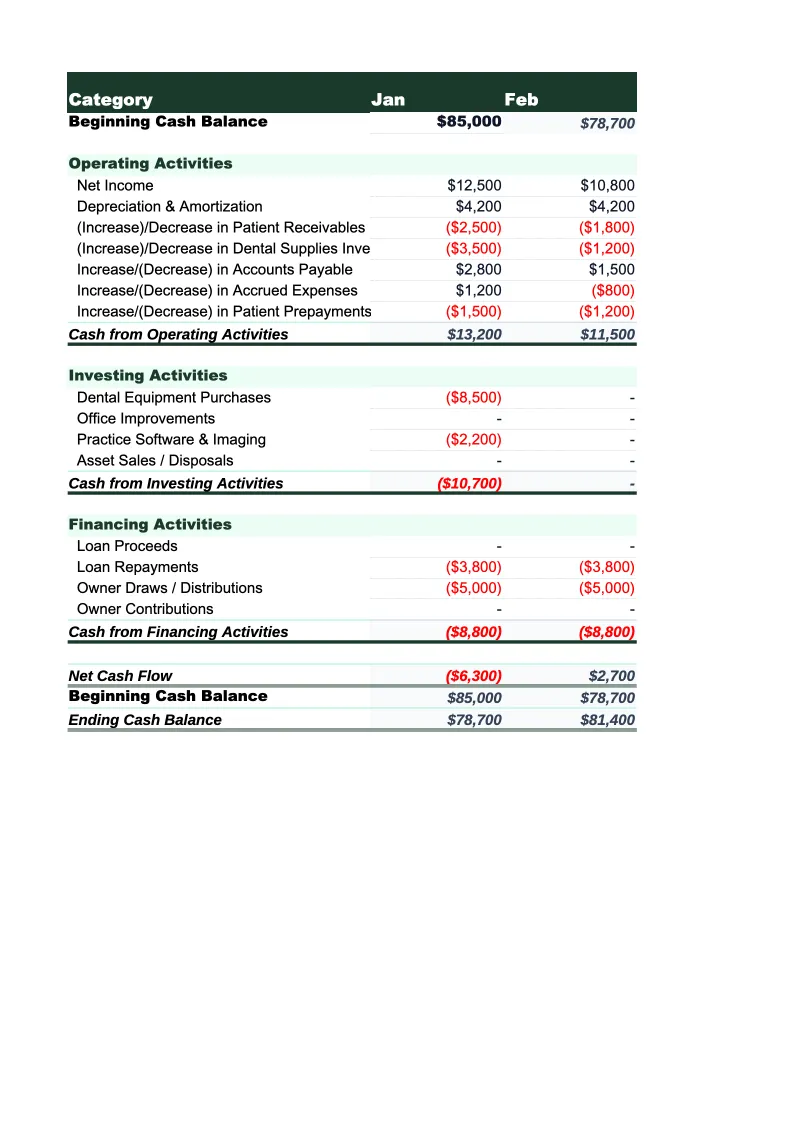
Monthly Cash Flow
A 12-month indirect-method cash flow statement organized into operating, investing, and financing activities.
Collections & AR Tracker
A dedicated sheet for tracking production, billing, and collections by payer type — the core metrics that determine whether a dental practice is actually converting its clinical work into cash.
Annual Summary
A full-year rollup of production, collections, and operating cash flow with the KPIs that practice owners and DSO acquirers use to evaluate financial health.
Dental Practice Cash Flow Template Features
- 13-week cash projection with insurance reimbursements, patient collections, and in-house financing remittances tracked as separate inflows with realistic payment timing
- Collections & AR Tracker with production, contractual adjustments, collection rate, and AR aging (0–30, 31–60, 61–90, 90+ days) split by insurance versus patient payer type
- Insurance receivables AR adjustment in the monthly indirect cash flow statement — so the model reflects the 30–45 day gap between clinical production and insurance payment
- Bi-weekly payroll planning rows aligned to actual pay dates, covering dentists, hygienists, assistants, and front-office staff
- Lab fee cycle tracking as a distinct monthly cash outflow, separate from supply orders and invoiced on net-30 terms from dental labs
- Collection rate, overhead percentage, lab-to-collections ratio, and hygiene production percentage — the four metrics buyers, lenders, and practice consultants look at first
How to Use This Dental Practice Cash Flow Spreadsheet
Download the .xlsx file and open it in Excel or Google Sheets. Start with the Collections & AR Tracker — enter your prior month's production by payer type (insurance and fee-for-service), your contractual adjustment percentages for each major carrier, and your current AR aging balances. The sheet will calculate your collection rate immediately, which tells you whether your starting cash position is based on a practice collecting close to 100% of what it's owed or one with a meaningful receivables problem. Then enter your outstanding AR by age bucket — this is the starting input that makes the 13-week projection accurate, because most of the insurance payments you'll collect over the next two to three weeks are for procedures already completed and claims already submitted.
Move to the 13-Week Cash Flow sheet and fill in projected insurance inflows week by week based on your current claim aging and your carriers' typical payment timelines. Most commercial PPO carriers pay within 14–30 days of clean claim submission; Medicaid and some HMO plans run 30–45 days. Patient portion collections are more predictable — co-pays collected at the chair on appointment days, billed balances spread over the following 30–60 days based on your statement cycle and patient payment rate. Enter your bi-weekly payroll dates and gross payroll amounts in the expense rows — this is the single most important item to get right because it's non-negotiable, and the weeks when payroll lands during a slow insurance payment window are where cash shortfalls occur. Add lab invoice payment dates (typically net-30 from the lab's invoice date) and supply order payment dates.
15 minutes from download to your first cash flow projection
Download the template, enter your current AR aging and payroll schedule, and see your dental practice's full cash picture — 13-week projection, collections tracker, and monthly statement included.
Why Dental Practices Need a Dedicated Cash Flow Template
Dental practices face a cash flow structure that looks simple on paper — patients come in, procedures are done, money is collected — but plays out very differently in practice. The core tension is between production and collections. A practice produces $180,000 in a given month, but 70% of that is billed to insurance carriers who will pay in 14–45 days, and another 15% is billed to patients who will pay over the next 30–90 days. Only about 15% — the patient portions collected at time of service — arrives as cash in the same week it was earned. The result is that a growing, productive dental practice can run perpetually short on cash not because it's unprofitable but because its receivables cycle creates a structural 30–45 day gap between when the work is done and when the cash lands. Understanding this gap, and projecting it forward week by week, is the primary job of a dental practice cash flow statement.
The metrics that matter most in dental practice cash flow are collection rate, overhead percentage, and AR aging. Collection rate — net collections divided by net adjusted production — should stay at 96–99% for a well-managed practice. Every percentage point below 99% represents real money that was earned but not collected; at $2M in annual adjusted production, the difference between 96% and 99% collection is $60,000 per year. Overhead as a percentage of collections should target 59–65% for a general practice; above 70%, the practice is typically unprofitable at current production levels. AR aging over 90 days is the early warning signal: once a balance ages past 90 days, the probability of collection drops to 60–70% for patient AR and even lower for disputed insurance claims. Lab fees deserve separate tracking because they scale directly with restorative production — as crown and implant cases grow, lab expenses should grow proportionally, and a lab cost ratio above 12% of collections typically signals either high-volume restorative (good) or a fee schedule problem (bad).
Dental Practice Industry at a Glance
Financial templates built for dental practices — from solo general dentists to multi-provider offices. Pre-loaded with CDT billing categories, insurance adjustment tracking, and the KPIs that matter to practice owners.
Revenue Drivers
- Patient exam and hygiene visits
- Restorative procedures (fillings, crowns, root canals)
- Implants and prosthetics
- Specialty services (whitening, Invisalign)
- Insurance reimbursements and fee-for-service collections
Key Cost Categories
- Staff salaries and benefits
- Dental supplies (chairside materials)
- Lab fees (outsourced crown and denture fabrication)
- Rent and facility
- Equipment and depreciation
- Marketing and patient acquisition
- Practice management software and billing systems
- Professional services (accounting, legal)
Typical Margins
Gross: 75-80% · Net: 30-40%
Seasonality
Summer peak driven by children's appointments before school year; year-end surge as patients use expiring insurance benefits; January restorative surge as annual maximums reset.
Key Performance Indicators
Dental Practice Cash Flow Template FAQ
More Dental Practice Templates
Dental Practice Balance Sheet Template for Excel
$29
Dental Practice Budget Template for Excel
$29
Dental Practice Business Plan Template for Excel
$39
Dental Practice Expense Tracker Template for Excel
$29
Dental Practice Financial Model Template for Excel
$29
Dental Practice Income Statement Template for Excel
$29
Dental Practice Invoice Template for Excel
$29
Dental Practice KPI Dashboard Template for Excel
$29
Dental Practice P&L Template for Excel
$29
Dental Practice Pro Forma Template for Excel
$29
Dental Practice Project Budget Template for Excel
$29
Dental Practice Sales Forecast Template for Excel
$29
Dental Practice Valuation Template for Excel
$29
Dental Practice Cash Flow Template
$29