Dental Practice Income Statement Template
Track revenue, collections, lab fees, and overhead for your dental practice — with an income statement built around how dental offices actually bill and operate.
What's Inside This Dental Practice Income Statement Template
This template includes 4 worksheets, each designed for a specific part of your dental practice financial workflow:
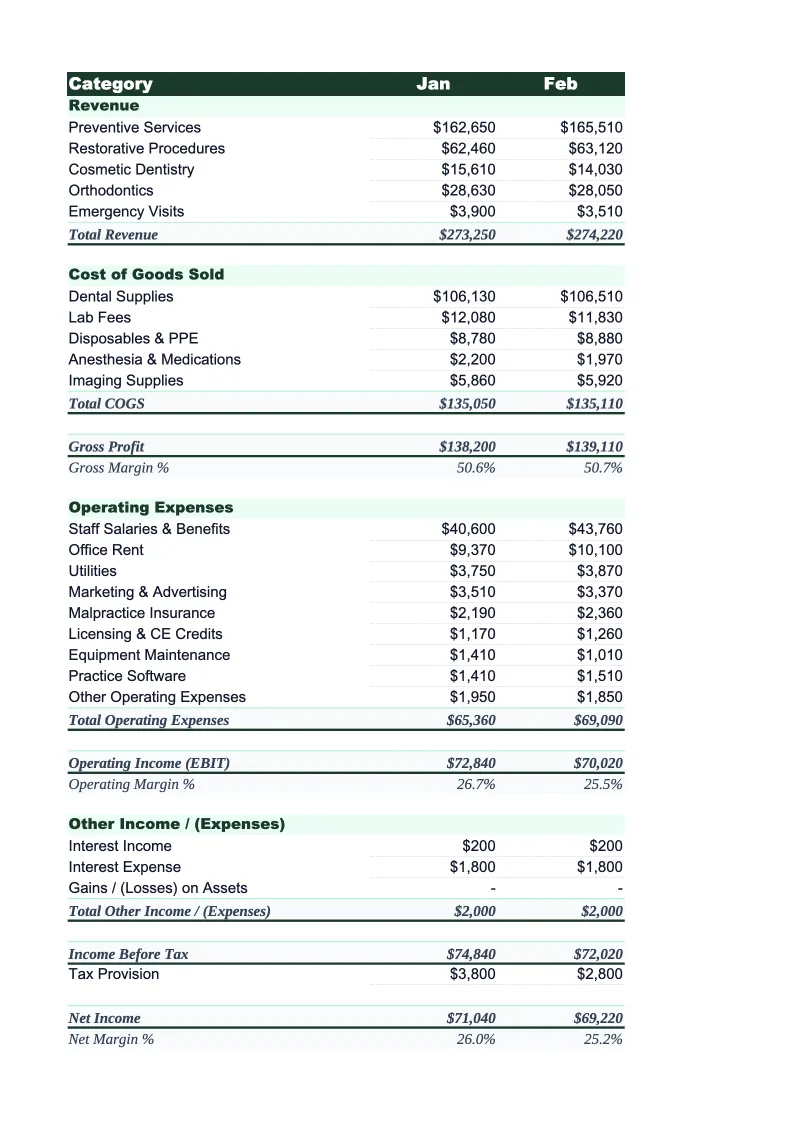
Monthly Income Statement
The core worksheet reporting each month's production, collections, and expenses.
Annual Summary
A 12-month rollup that pulls from each monthly sheet automatically, showing full-year production, collections, gross profit, and net income in one view.
Provider Breakdown
A per-provider income statement that splits production and collections by dentist or hygienist.
Dashboard
A visual summary with pre-built charts covering the KPIs that matter most to dental practice owners: monthly collections trend, overhead as a percentage of collections, gross profit margin, net income by month, and lab fees as a percentage of production.
Dental Practice Income Statement Features
- Revenue split by hygiene, restorative, implants, and specialty services
- Insurance adjustments and write-offs tracked separately from gross production
- Lab fees and dental supplies tracked as direct costs against production
- Per-provider production and collection rate breakdown
- Overhead as % of collections auto-calculated each month
- Annual rollup with 12-month trend charts
How to Use This Dental Practice Income Statement Spreadsheet
Download the .xlsx file and open it in Excel or Google Sheets — no macros or plugins required. Start with the Monthly Income Statement sheet and review the pre-loaded service categories and expense line items. Most dental practices will recognize the structure immediately; adjust any category names to match how your practice management software (Dentrix, Eaglesoft, Open Dental) reports production. The whole setup takes about 15–20 minutes, and most of that is matching your chart of accounts to the template's categories.
Each month, pull your production and collections report from your practice management software and enter the totals by category. Enter insurance adjustments and write-offs in the designated rows so your net collections calculate correctly. Then enter your expense totals for supplies, lab fees, payroll, and overhead — most of these come straight from your bank statement or payroll report. If you have multiple providers, also fill in the Provider Breakdown sheet with each provider's production and collections. The Dashboard and Annual Summary update automatically.
15 minutes from download to your first income statement
Download the template, enter your production and collections data, and see your dental practice's full financial picture — including overhead rate, collection rate, and net income by month.
Why Every Dental Practice Needs an Income Statement Template
Dental practices have unusually strong gross margins — 75–80% is typical because most direct costs are supplies and lab fees, which are a small percentage of production. The challenge is the operational complexity: you're billing multiple payers (insurance plans plus fee-for-service patients), managing adjustments and write-offs that can run 20–30% of gross production, and tracking collections that often lag production by 30–60 days. A standard income statement template doesn't capture any of this. A dental-specific one does.
The number that defines practice profitability isn't gross margin — it's overhead as a percentage of collections. Dental consulting firms set the benchmark at 59–65%; practices running above 70% are usually overstaffed, underproducing, or both. The main expense buckets to watch are staff (typically 25–30% of collections), occupancy (5–8%), dental supplies (5–6%), and lab fees (8–12%). When overhead climbs, it almost always traces back to one or two of these categories. The income statement gives you the data to figure out which one.
Dental Practice Industry at a Glance
Financial templates built for dental practices — from solo general dentists to multi-provider offices. Pre-loaded with CDT billing categories, insurance adjustment tracking, and the KPIs that matter to practice owners.
Revenue Drivers
- Patient exam and hygiene visits
- Restorative procedures (fillings, crowns, root canals)
- Implants and prosthetics
- Specialty services (whitening, Invisalign)
- Insurance reimbursements and fee-for-service collections
Key Cost Categories
- Staff salaries and benefits
- Dental supplies (chairside materials)
- Lab fees (outsourced crown and denture fabrication)
- Rent and facility
- Equipment and depreciation
- Marketing and patient acquisition
- Practice management software and billing systems
- Professional services (accounting, legal)
Typical Margins
Gross: 75-80% · Net: 30-40%
Seasonality
Summer peak driven by children's appointments before school year; year-end surge as patients use expiring insurance benefits; January restorative surge as annual maximums reset.
Key Performance Indicators
Dental Practice Income Statement Template FAQ
More Dental Practice Templates
Dental Practice Balance Sheet Template for Excel
$29
Dental Practice Budget Template for Excel
$29
Dental Practice Business Plan Template for Excel
$39
Dental Practice Cash Flow Template for Excel
$29
Dental Practice Expense Tracker Template for Excel
$29
Dental Practice Financial Model Template for Excel
$29
Dental Practice Invoice Template for Excel
$29
Dental Practice KPI Dashboard Template for Excel
$29
Dental Practice P&L Template for Excel
$29
Dental Practice Pro Forma Template for Excel
$29
Dental Practice Project Budget Template for Excel
$29
Dental Practice Sales Forecast Template for Excel
$29
Dental Practice Valuation Template for Excel
$29
More Income Statement Templates
Accounting Firm Income Statement Template for Excel
$29
Auto Repair Income Statement Template for Excel
$29
Car Wash Income Statement Template for Excel
$29
Church Income Statement Template for Excel
$29
Cleaning Service Income Statement Template for Excel
$29
Coffee Shop Income Statement Template for Excel
$29
Dental Practice Income Statement Template
$29