Dental Practice Sales Forecast Template
Project your dental practice's revenue by procedure mix, patient volume, and insurance vs. fee-for-service collections — with monthly targets and variance tracking built in.
What's Inside This Dental Practice Sales Forecast Template
This template includes 5 worksheets, each designed for a specific part of your dental practice financial workflow:
Revenue Drivers
The foundation of the forecast.
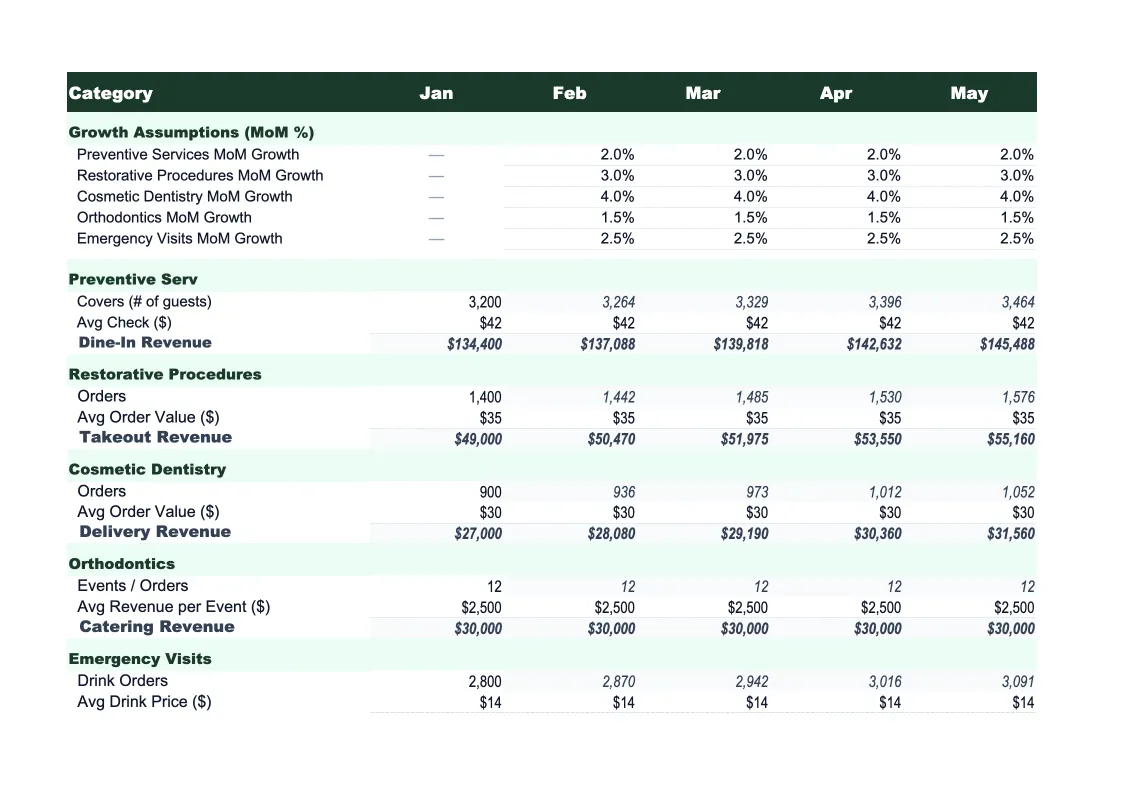
Monthly Forecast
A 12-month revenue projection broken down by procedure category: hygiene and preventive, restorative (fillings and crowns), endodontics (root canals), prosthetics and implants, and elective/cosmetic services.
Actual vs Forecast
Enter your actual monthly collections alongside your forecast and the sheet calculates dollar variance and percentage variance for each revenue category.
Scenario Planner
Model three revenue scenarios side by side — base case, upside, and downside — by adjusting patient volume, procedure mix, and collection rate assumptions independently for each.
Dashboard
A one-page visual summary with charts for monthly production trend, collections by procedure category, fee-for-service vs.
Dental Practice Sales Forecast Template Features
- Revenue drivers split by hygiene, restorative, specialty, and elective procedure categories
- Gross production vs. net collections model with insurance adjustment and write-off tracking
- 12-month monthly forecast with seasonal adjustments for summer peak and year-end insurance rush
- Actual vs. forecast variance tracking with conditional formatting for underperformance flags
- Three-scenario planner for modeling associate additions, new services, or insurance changes
- Dashboard with production trend, collections by category, and fee-for-service vs. insurance split
How to Use This Dental Practice Sales Forecast Spreadsheet
Start with the Revenue Drivers sheet. Enter your current monthly patient visit counts by category (hygiene, restorative, specialty), your average production per visit for each, and your insurance vs. fee-for-service split. If you're not sure of your averages, pull your last three months of practice management software reports — most systems like Dentrix, Eaglesoft, or Open Dental can export production and collection summaries in minutes. Set your collection rate based on your last 12 months of actual data; most general practices run 96–99%.
Once your drivers are set, move to the Monthly Forecast sheet. Review the auto-calculated projections for each procedure category and adjust the seasonal multipliers if your practice has distinct slow months or peaks. The year-end insurance rush (November–December) and summer hygiene peak for families are pre-loaded as default multipliers, but you can adjust them based on your patient demographic. Add notes in the comment cells for any planned changes — a new associate starting in Q3, a marketing push for implants — so the forecast tells a story, not just a number.
15 minutes from download to your first dental practice forecast
Download the template, enter your procedure mix and patient volume, and get a clear 12-month revenue projection with monthly variance tracking built in.
Why Every Dental Practice Needs a Sales Forecast Template
Dental practice revenue forecasting is more complex than most service businesses because of the gap between gross production and net collections. A practice might produce $80,000 in a month but collect $62,000 after insurance adjustments, write-offs, and uncollected patient balances. Practice owners who budget on gross production — a common mistake — routinely underestimate how much revenue is actually lost to contractual adjustments and AR problems. A proper sales forecast models gross production and collections separately, tracks your collection rate as a managed metric, and gives you a realistic picture of what will actually land in your bank account.
The procedure mix matters as much as patient volume. Hygiene visits drive predictable, recurring revenue but are lower production per appointment; restorative and specialty procedures (crowns, implants, Invisalign) generate five to ten times the per-visit production but depend on case acceptance rates. A practice with 200 monthly hygiene visits and a 35% case acceptance rate will have very different revenue than one with 180 visits and 75% case acceptance, even if the patient counts look similar. Good forecasting breaks revenue down by category so you can see which procedures are driving growth and where case presentation improvements would have the most financial impact.
Dental Practice Industry at a Glance
Financial templates built for dental practices — from solo general dentists to multi-provider offices. Pre-loaded with CDT billing categories, insurance adjustment tracking, and the KPIs that matter to practice owners.
Revenue Drivers
- Patient exam and hygiene visits
- Restorative procedures (fillings, crowns, root canals)
- Implants and prosthetics
- Specialty services (whitening, Invisalign)
- Insurance reimbursements and fee-for-service collections
Key Cost Categories
- Staff salaries and benefits
- Dental supplies (chairside materials)
- Lab fees (outsourced crown and denture fabrication)
- Rent and facility
- Equipment and depreciation
- Marketing and patient acquisition
- Practice management software and billing systems
- Professional services (accounting, legal)
Typical Margins
Gross: 75-80% · Net: 30-40%
Seasonality
Summer peak driven by children's appointments before school year; year-end surge as patients use expiring insurance benefits; January restorative surge as annual maximums reset.
Key Performance Indicators
Dental Practice Sales Forecast Template FAQ
More Dental Practice Templates
Dental Practice Balance Sheet Template for Excel
$29
Dental Practice Budget Template for Excel
$29
Dental Practice Business Plan Template for Excel
$39
Dental Practice Cash Flow Template for Excel
$29
Dental Practice Expense Tracker Template for Excel
$29
Dental Practice Financial Model Template for Excel
$29
Dental Practice Income Statement Template for Excel
$29
Dental Practice Invoice Template for Excel
$29
Dental Practice KPI Dashboard Template for Excel
$29
Dental Practice P&L Template for Excel
$29
Dental Practice Pro Forma Template for Excel
$29
Dental Practice Project Budget Template for Excel
$29
Dental Practice Valuation Template for Excel
$29
More Sales Forecast Templates
Dental Practice Sales Forecast Template
$29