Accounting Firm Income Statement Template
Report your accounting firm's revenue and expenses with an income statement built around how CPA practices actually earn — tax, audit, bookkeeping, advisory, and payroll — with service line profitability and key practice metrics built in.
What's Inside This Accounting Firm Income Statement Template
This template includes 4 worksheets, each designed for a specific part of your accounting firm financial workflow:
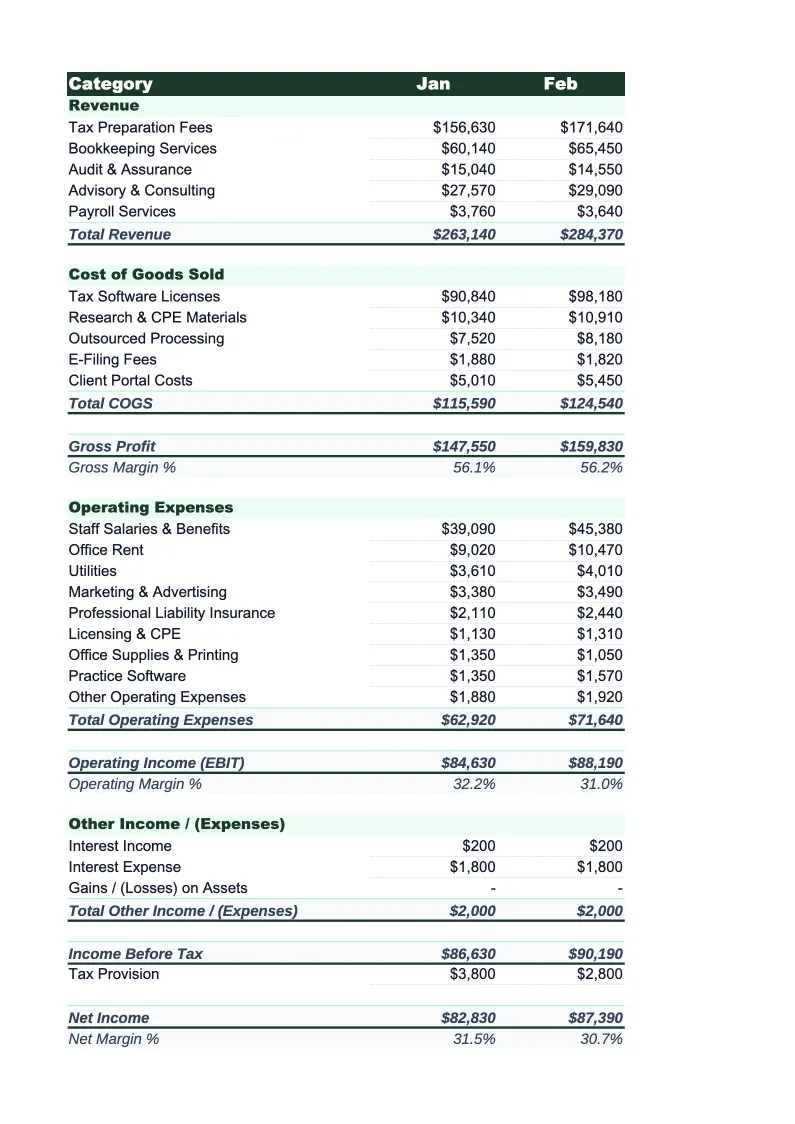
Monthly Income Statement
The core worksheet where you record each month's revenue and expenses using accounting-firm-specific line items.
Annual Summary
A 12-month rollup that aggregates data from each monthly income statement automatically.
Service Line Profitability
A worksheet for tracking revenue and direct costs at the individual service line or client segment level.
Dashboard
A one-page visual summary with pre-built charts covering revenue by service line, gross margin trend by month, operating expense breakdown, and net income across the year.
Accounting Firm Income Statement Template Features
- Revenue split by service line: tax, audit, bookkeeping/CAS, advisory, and payroll
- Cost of services tracking for professional staff, subcontractors, and direct client expenses
- Service line profitability sheet with realization rate and effective revenue per hour
- Utilization rate, realization rate, and collection rate auto-calculations
- 12-month annual rollup with busy-season visibility built in
- Visual dashboard with service mix breakdown, margin trends, and key practice KPIs
How to Use This Accounting Firm Income Statement Spreadsheet
Getting started takes about 15 minutes. Download the .xlsx file and open it in Excel or Google Sheets — no macros or plugins required. Start with the Monthly Income Statement sheet and review the pre-loaded revenue and expense line items. Most accounting firms keep the core service line structure and adjust a few categories to match their specific practice mix — for instance, splitting tax revenue between individual and business returns, adding a line for state and local tax consulting, or breaking out CAS clients by tier.
Once the categories match your practice, enter revenue and expenses for the current month. If you track time in a practice management system, pull your billed revenue report by service line and your WIP report for unbilled work. Enter staff and subcontractor costs from your payroll records, and operating expenses from your bank and credit card statements. The Service Line Profitability sheet is where you'll spend the most initial setup time — enter each service line's billed revenue and allocated hours so the realization rate and effective hourly rate calculations give you meaningful data from month one.
15 minutes from download to your first income statement
Download the template, enter your service line revenue and staff costs, and see your accounting firm's gross margin, net income, and service line profitability in one place.
Why Every Accounting Firm Needs an Income Statement
Accounting firm income statements are more nuanced than they appear because revenue doesn't move in a straight line. Tax season concentrates a large share of annual revenue into four months, while audit and advisory engagements spread more evenly across the calendar. CAS clients generate predictable monthly recurring revenue, but at lower billing rates than compliance work. Without a proper income statement that separates these revenue streams, it's easy to confuse a strong April with a strong business — and to miss the fact that net margin is quietly compressing as staff salaries and technology costs grow faster than average billing rates.
The two numbers that matter most in an accounting firm income statement are gross margin and realization rate. Gross margin — revenue minus direct cost of services including professional staff time, subcontractors, and direct client costs — typically falls between 50% and 65% for established CPA practices. Realization rate measures how much of your standard billing rate you actually collect: if your staff bills 100 hours at $200/hour but you invoice only $18,000, your realization rate is 90%. Most healthy firms target realization rates above 85%; rates consistently below 75% usually signal that fixed-fee engagements are being underpriced or that write-downs are masking scope creep. Net margins of 20–35% are typical, with boutique tax practices often running higher and audit-heavy firms running lower due to compliance overhead.
Accounting Firm Industry at a Glance
Financial templates built for accounting firms and CPA practices — from solo practitioners to multi-partner firms. Pre-loaded with billable hour tracking, realization rate calculations, and service categories that reflect how accounting firms actually bill.
Revenue Drivers
- Tax preparation and planning
- Audit and assurance
- Bookkeeping and client accounting services (CAS)
- Advisory and fractional CFO services
- Payroll processing
Key Cost Categories
- Professional staff salaries and benefits
- Administrative staff
- Occupancy and rent
- Technology and software (tax, practice management)
- Malpractice (E&O) insurance
- Marketing and business development
- CPE and professional development
- Subcontractors and offshore staff
Typical Margins
Gross: 50-65% · Net: 20-35%
Seasonality
Heavy busy season January through April 15; secondary crunch in September through October 15 for extensions. Slowest months are July and August.
Key Performance Indicators
Accounting Firm Income Statement Template FAQ
More Accounting Firm Templates
Accounting Firm Balance Sheet Template for Excel
$29
Accounting Firm Budget Template for Excel
$29
Accounting Firm Business Plan Template for Excel
$39
Accounting Firm Cash Flow Template for Excel
$29
Accounting Firm Expense Tracker Template for Excel
$29
Accounting Firm Financial Model Template for Excel
$29
Accounting Firm Invoice Template for Excel
$29
Accounting Firm KPI Dashboard Template for Excel
$29
Accounting Firm P&L Template for Excel
$29
Accounting Firm Pro Forma Template for Excel
$29
Accounting Firm Project Budget Template for Excel
$29
Accounting Firm Sales Forecast Template for Excel
$29
Accounting Firm Valuation Template for Excel
$29
More Income Statement Templates
Accounting Firm Income Statement Template
$29